Trend trading is a trading style that attempts to profit by analyzing the ongoing trend in a particular direction using trend indicators.
When the price of a stock moves in a particular direction, such as up or down, then it is called a trend.
Traders who follow trend trading enter a long position when the stock is trending upward. Whereas, trend traders enter a short position when an asset is trending downward.
Trend traders gain profit from trading with the trends. This method of trend trading captures profits through the stock momentum analysis in a particular direction.
Trend indicators help the traders in analyzing whether the trends will continue or reverse.
Of course, no single technical indicator will help you in gaining profits, traders also need well-defined risk management and trading psychology.
Below are the most used 5 trend indicators that will help the traders in conducting trend analysis:
1. Moving Average
Moving average is a trend indicator that smooths out price data constantly by making average prices. On a price chart, a moving average is a flat line that reduces variations because of random price fluctuations.
The average can be of any period of time– say 10 days, 30 minutes, one week, or any other time period the trader chooses. For long-term trend traders, the 200-day, 100-day, and 50-day simple moving averages are popular moving averages.
There are many ways to trade with the moving average:
Traders can analyse the angle of the moving average. If it is mostly moving horizontally then the price is ranging.
If the moving average line is angled up, then the current trend is an uptrend. However, moving averages don’t predict the future value of a stock; they just reveal what the price is doing over a period of time.
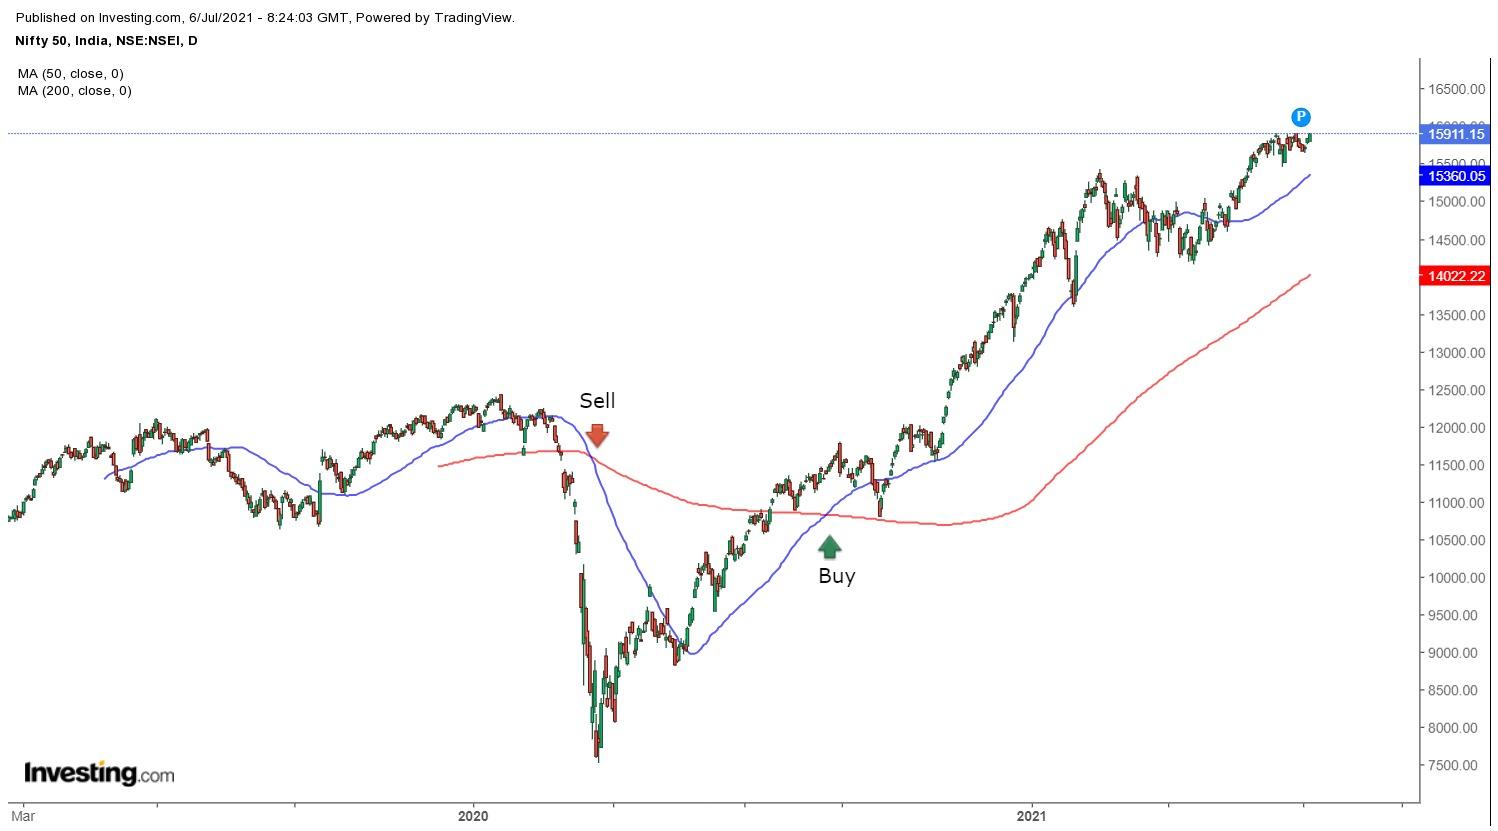
Crossovers are another way for analysing the moving averages. Traders can plot a 200-day and 50-day moving average on the chart, a buy signal occurs when the 50-day moves above the 200-day. A sell signal occurs when the 50-day drops below the 200-day as shown below:
2. Supertrend:
As the name suggests, Supertrend is a trend indicator and indicates that the direction of the price movement in a market is trending,
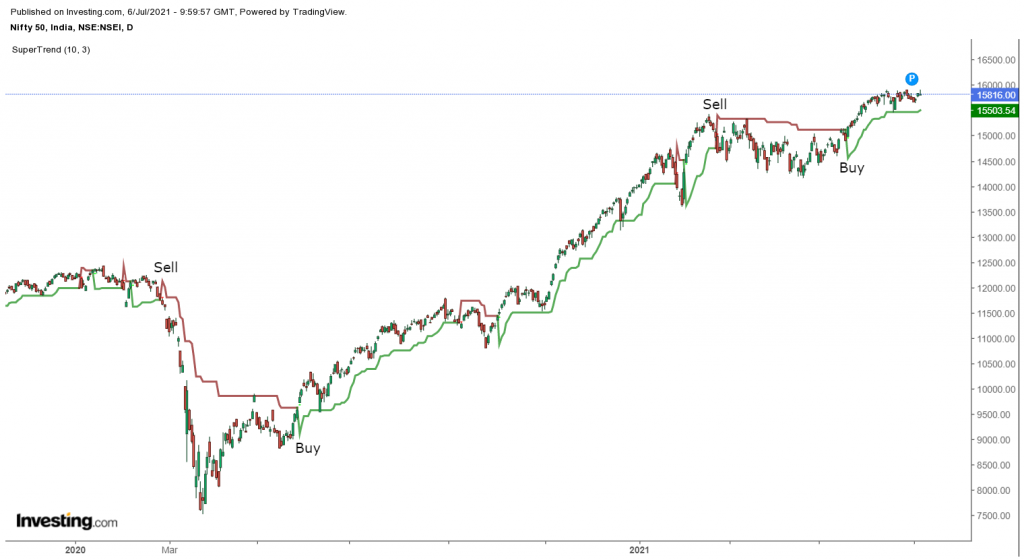
A super-trend indicator is plotted either above or below the closing price. The indicator changes colour, based on the change in the direction of the trend.
If the super-trend indicator moves below the closing price, then the indicator turns green and gives a buy signal. If a super-trend closes above, then the indicator shows a sell signal in red.
3. Parabolic SAR:
Parabolic SAR is another famous trend indicator that highlights the direction in which a security is moving.
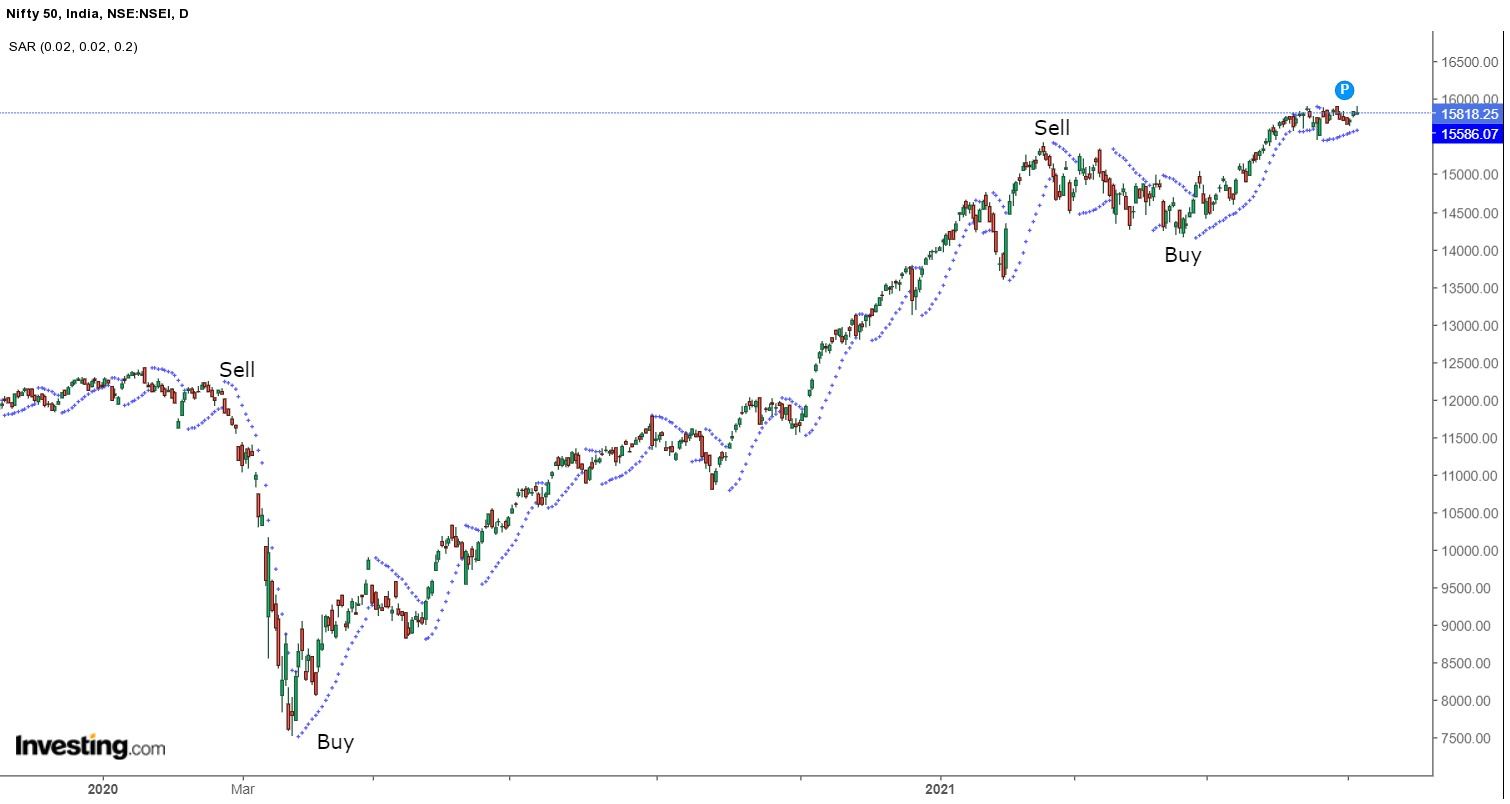
On a chart, the indicator looks like a series of dots that are placed either above or below the price bars.
A dot below the price indicates a bullish signal and a dot above the price shows that the bears are in control and that the momentum may remain downward.
When the dots reverse then it indicates that a potential change in price direction is going to take place as shown below:
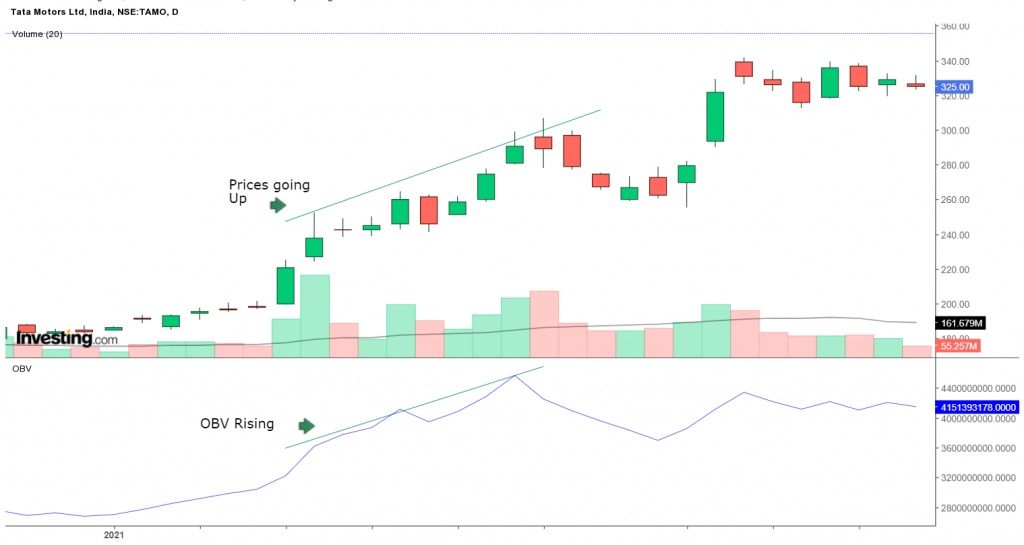
4. On-Balance Volume
The On-Balance indicator is a trend as well as a volume indicator.
This trend indicator calculates cumulative buying and selling pressure by adding the volume on “up” days and subtracting volume on “down” days.
It is important that volume should confirm trends. A rise in the price should be accompanied by a rising OBV and a fall in the price should be accompanied by a falling OBV.
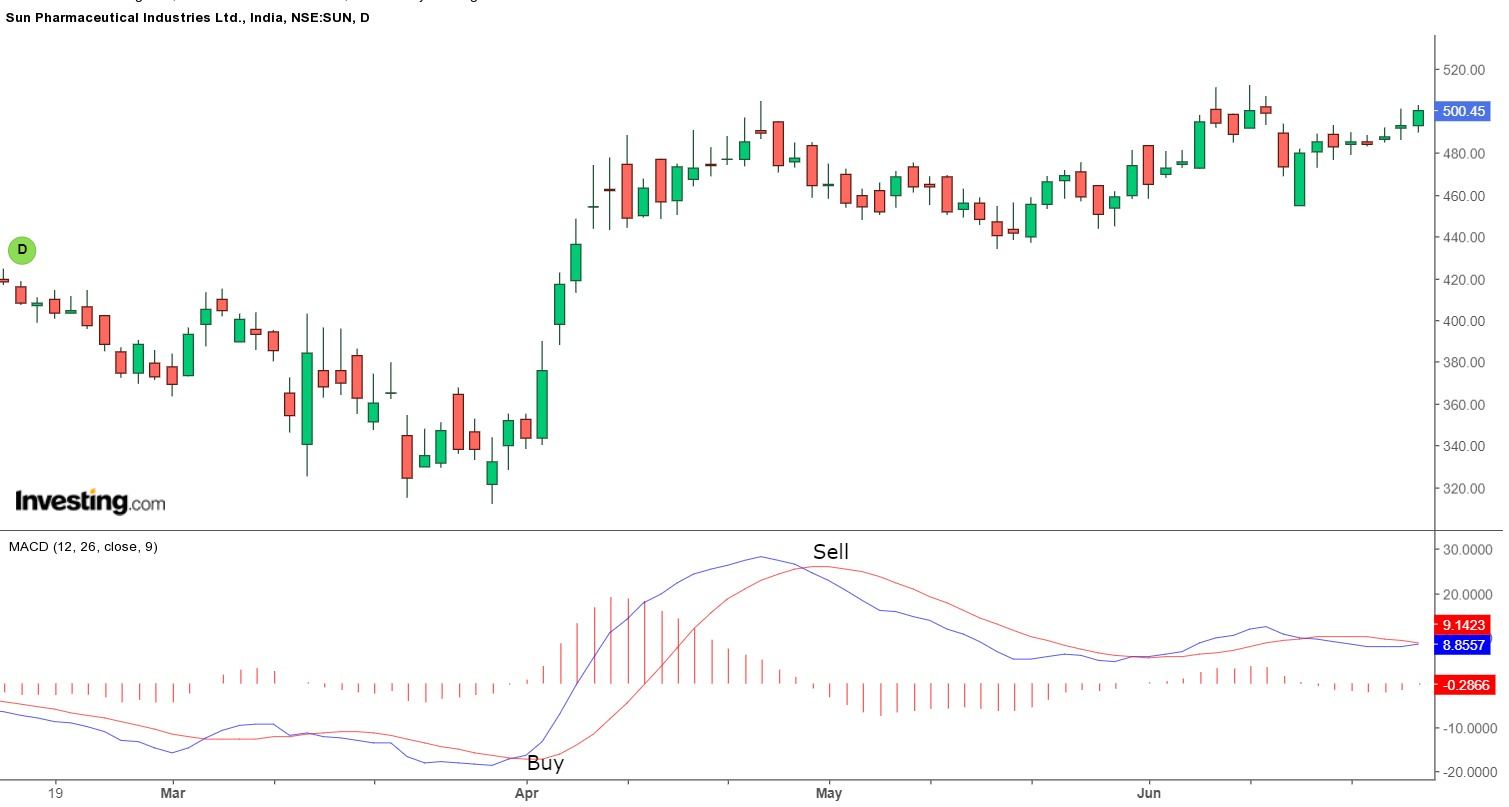
5. MACD (Moving Average Convergence, Divergence)
MACD is one of the widely used trend indicators that consists of the MACD and signal line.
Signal line crossovers can provide traders with buy and sell signals. A buy signal occurs when the MACD line crosses above the signal line and a sell signal occurs when the MACD line crosses below the signal line.
Watch our video on Trend Indicators
Bottomline
The popularity of these trend indicators is higher these days because of the mass adaptation of online trading. All the trend indicators which we have discussed above are widely used but one should remember that no indicator gives 100% accurate results. These indicators can be combined with other momentum and volume indicators to build a good trading setup.
Frequently Askes Questions (FAQs)
What are trend indicators, and why are they important?
Technical analysts utilize trend indicators as a tool to determine the direction of financial market price movements. They support traders in identifying patterns, which is essential for making wise trading choices.
How does the Moving Average indicator work?
The average price over a certain period is represented by a single flowing line that is created by smoothing out price data using moving averages. By indicating whether prices are frequently rising, decreasing, or moving sideways, they assist traders in identifying patterns.
What is the significance of MACD in trend analysis?
Moving averages are combined in the flexible MACD indicator to determine momentum strength and trend direction. It helps traders determine whether a trend is likely to revers or continue by including a histogram and fast and slow lines.
For more stock related queries visit web.stockedge.com


Excellent information…
Hi,
We really appreciated that you liked our blog.
Keep Reading!!
Hi is there a way to bookmark these articles for future reference or even better would be to download and saved?
Hi,
You can bookmark our blog website for future reference, as of now there is no option to save.
We really appreciate that you liked our blogs!
Thank you for the feedback!
Keep Reading!
Fabulous
Hi,
We really appreciated that you liked our blog.
Keep Reading!!
Sir, Very good information.
Hi,
We really appreciated that you liked our blog.
Keep Reading!