Do you know that technical analysis has many indicators to guide us but all of them are not suited for intraday trading! Yes, some particular technical indicators are best suited for traders who want to square off their position within a day.
Intraday trading refers to short-term trading in which the traders take benefits of price fluctuations in the stock market and earn profits. But to be successful in this trading technique we need to analyse the technical charts using price actions and intraday trading indicators for making profits. I would like to tell you Intraday trading can be done with any financial assets such as stocks, derivatives, currency or commodities that are actively traded in the market.
So, in this week’s blog, I will be discussing the 6 Most Used Intraday Trading Indicators that can be used by traders for intraday trading:
6 Top Indicators for Intraday Trading:
1. SuperTrend
Let’s start our discussion with the Supertrend indicator that can be used as an intraday trading indicator. This indicator is plotted on the price chart and the current trend can simply be determined by its placement vis-a-vis price. It is a very simple indicator that is constructed with just two parameters- period and multiplier.
So, when we construct the Supertrend indicator, we generally use the default parameters 10 for Average True Range (ATR) and 3 for its multiplier. The average true range (ATR) plays an important role in ‘Supertrend’ as it uses ATR for computing its value and signals the degree of price volatility.
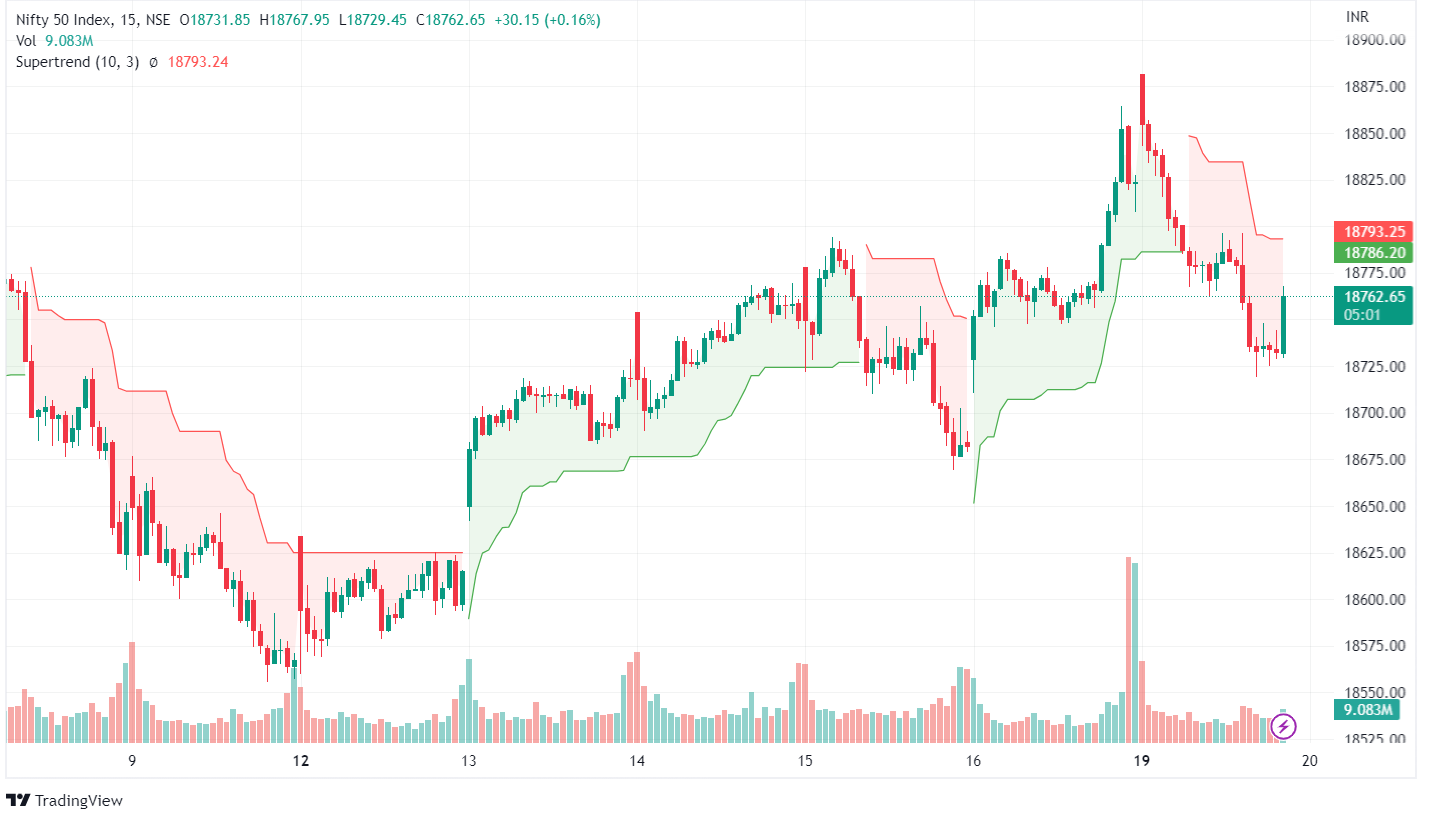
Supertrend indicates that the trend is in the upward direction when it is placed below the bars, and the trend is in a downward direction when it is placed above the bars, as shown above. This indicator indicates a buy signal when it closes below the price and the colour changes to green. On the other hand, a sell signal is made when the Super Trend closes above the price and the colour turns red.
2. VWAP
The second intraday trading indicator is VWAP- Volume Weighted Average Price. When trading intraday, traders need to track the volume in the stock. VWAP is a volume indicator of the ratio of the value of a stock traded at a particular time to the total volume traded at that stock for a particular stock.
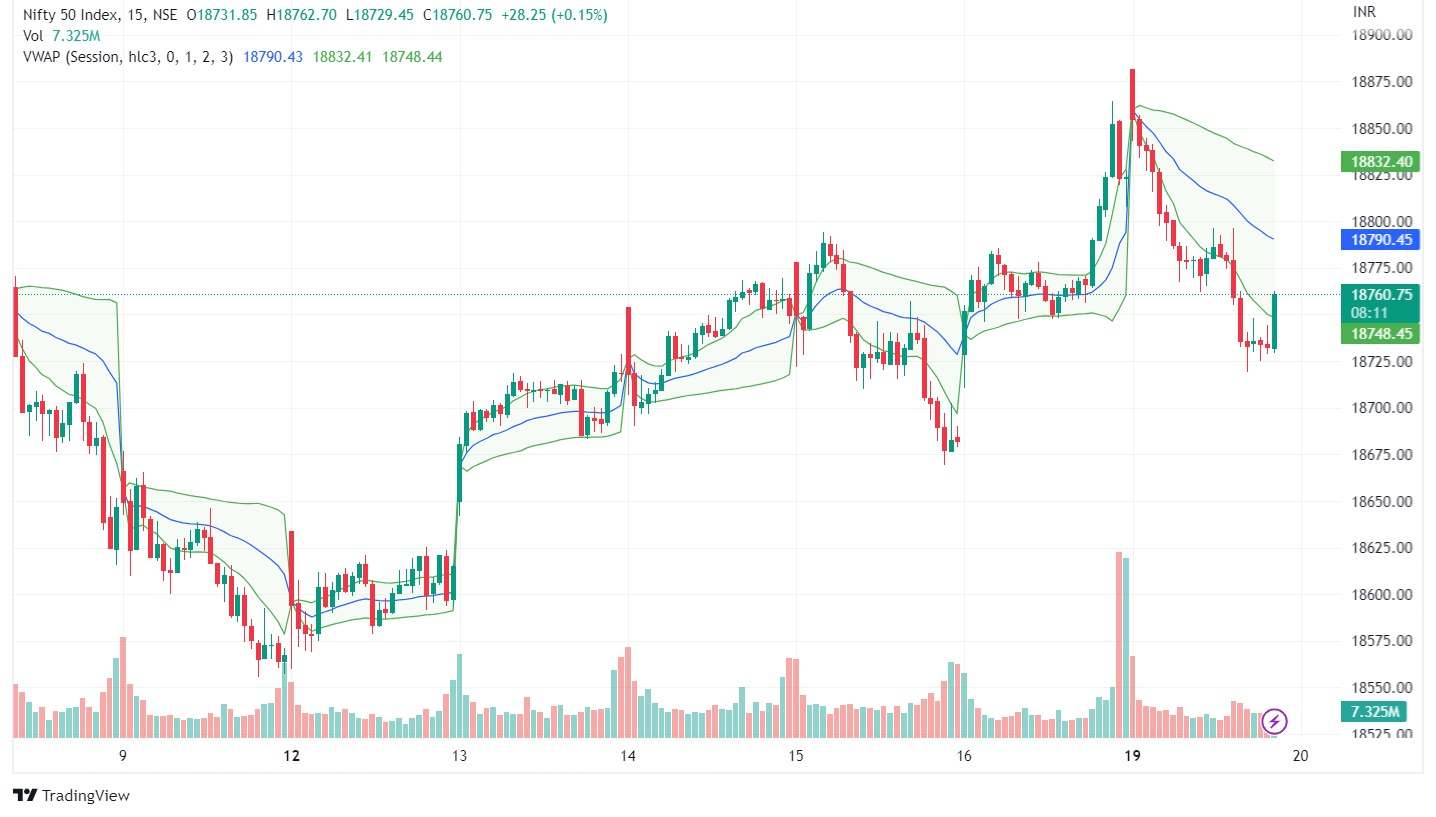
This indicator indicates a bullish trend when the price of a stock is above VWAP. This means that the price is above average volume and the trend is positive. We can enter the stock in this particular condition on a retracement to VWAP in the direction of the trend. Similarly, a bearish trend can be confirmed when the price moves below the VWAP line. You can sell at the VWAP in the direction of the trend.
I would strongly recommend watching our webinar on INTRADAY TRADING WITH VWAP INDICATOR if you want to learn more about intraday trading with this indicator.
3. Stochastics
Stochastic is a momentum indicator that has been around for a long time and is suitable for both intraday trading and also swing trading. When doing intraday trading it is important to analyze the momentum of the stock in which we are trading. Stochastic was developed by George C Lane in 1950’s.
Stochastic Indicator is calculated using the below formula:
%K = (Current Close – Lowest Low)/(Highest High – Lowest Low) * 100
%D = 3-day SMA of %K
Lowest Low = lowest low for the look-back period
Highest High = highest high for the look-back period
The default look-back period is 14 days which can be changed according to the trading style of the traders, for example, intraday traders can use shorter period Stochastics. Trading signals are generated when %K line of Stochastic crosses %D line.
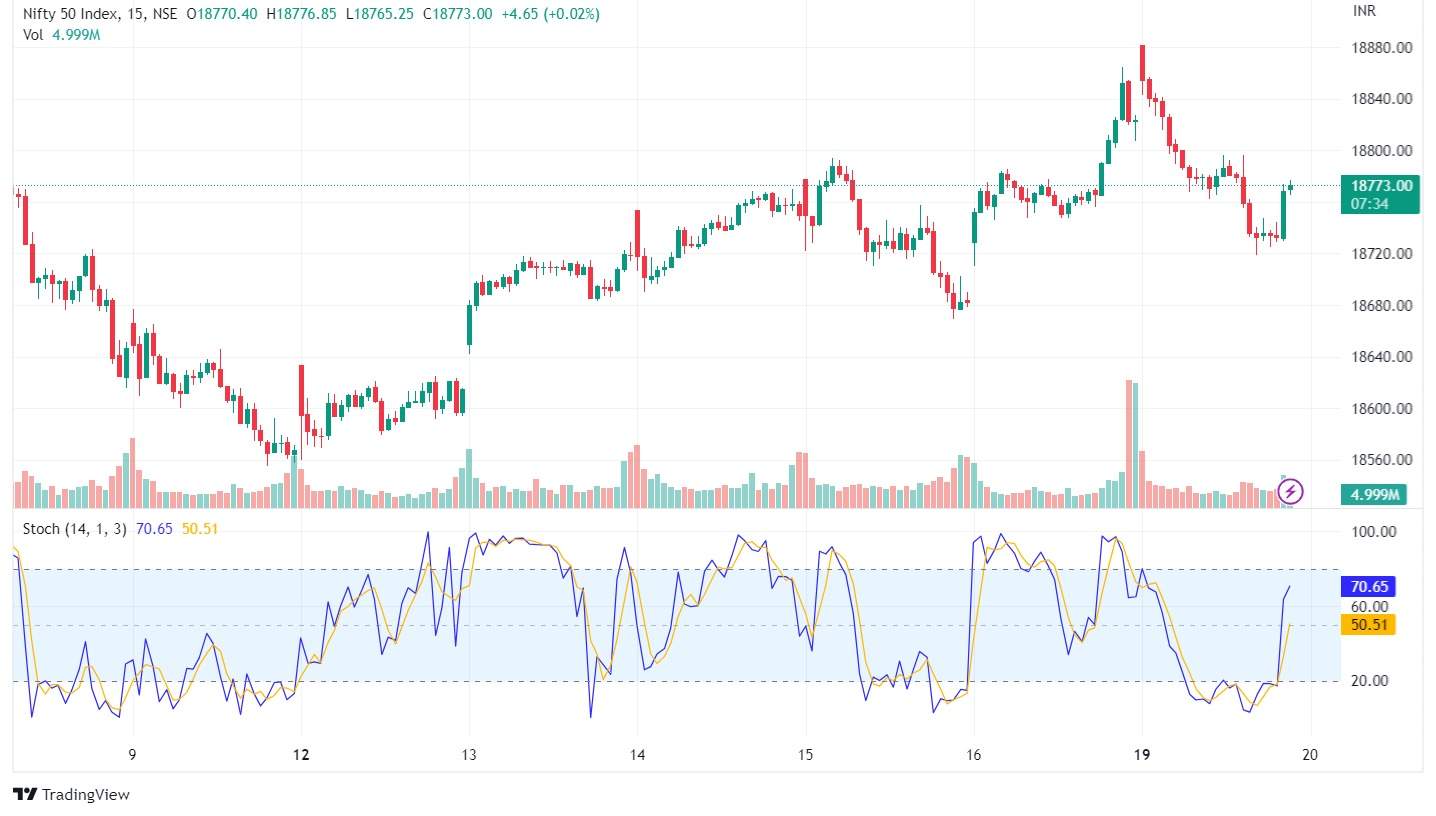
Stochastic Divergences also help the intraday traders to determine price reversals. Divergence occurs when the direction of the price trend and the direction of the indicator trend are moving in the opposite direction.
Learn more about Intraday Trading from our ELM School Module on Intraday Trading
4. Average Directional Index
According to me “trend” is the best friend of every intraday trader and the ADX indicator helps us in determining the trend’s strength.
ADX tells us whether the ongoing trend has the strength to continue going up or down. Its values oscillate between 0 to 100, and one should remember that the higher the value higher will be the strength of the trend. The default look-back period of ADX is 14 periods but can be changed according to the volatility of stock or index.
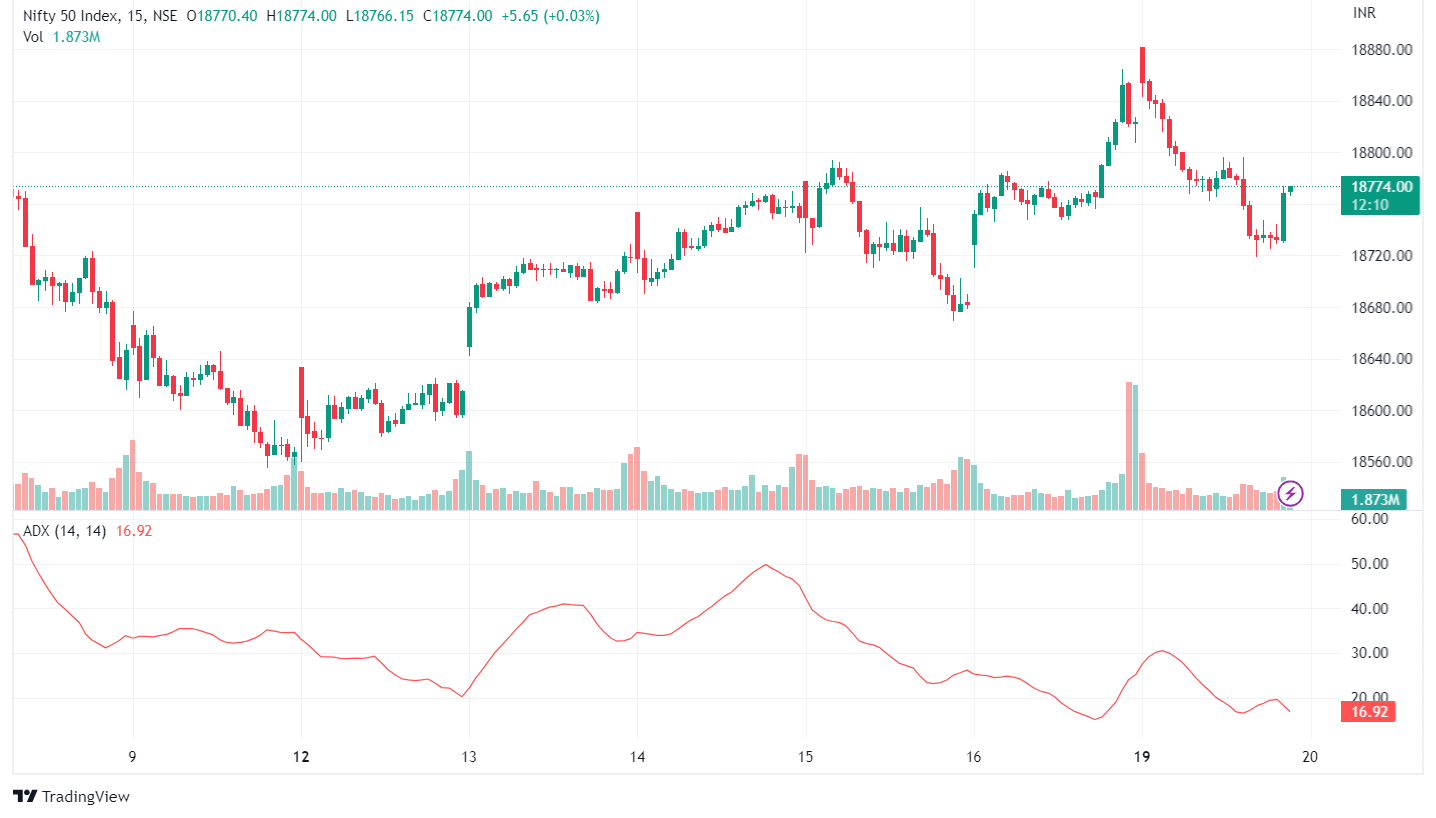
Usually, ADX value below 25 indicates a very weak trend whereas value above 75 indicates a very strong trend. ADX is generally not used alone, rather it is used along with other trend-following indicators like Supertrend for filtering the false signals.
5. On-Balance Volume
On Balance Volume (OBV) is again a popular volume indicator that tracks the absolute volume change for speculating price movement. Most traders believe that volume drives price because of the aggressive trades from institutional investors. Thus, the On Balance Volume indicator help us in tracking this smart money flow into the market and also signals future price direction.
If there is a change in OBV value that is higher than a change in price for a given time period, then we may see a sharp upside or downside in price in the near future.
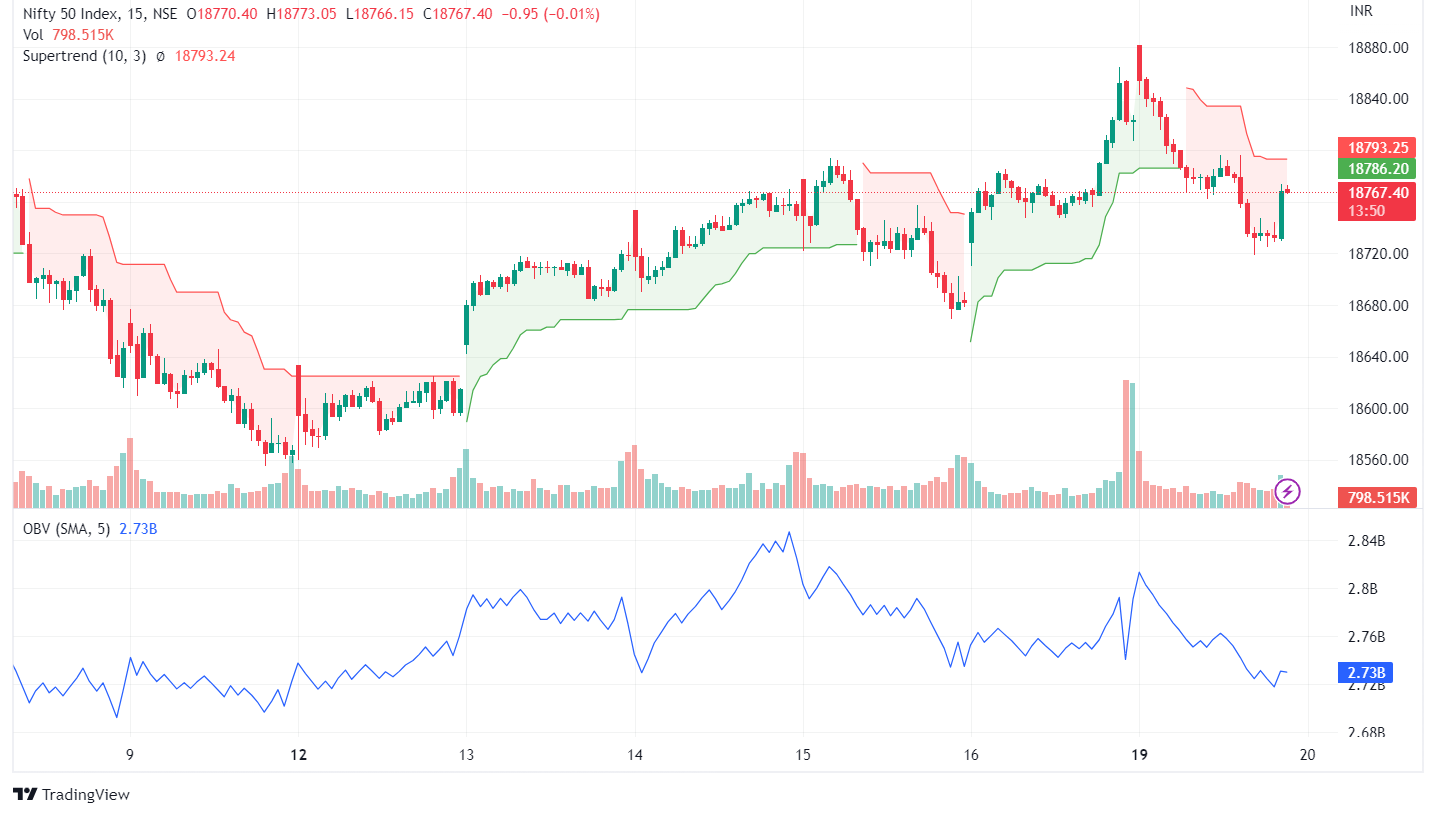
One can trade using OBV Divergences that can be reliable too. Bullish divergence is formed when OBV forms a higher high and higher low, while price forms a lower low. On the other hand, Bearish divergence is formed when OBV forms a lower high and lower low, whereas price forms a higher high, as shown in the above chart.
6. Donchian Channel
When doing intraday trading one also needs to analyse volatility indicators that help us in analysing if the volatility in the stock is high or low. We can use the Donchian channel for this purpose in intraday trading. Donchian Channel is constructed by calculating the Highest High and Lowest Low for a pre-defined period.
When there is a breakout of the Donchian channel from the upper or lower band then it is considered as the starting of a new trend. The Donchian channel is also useful for studying the volatility of the price as shown in the above chart. If the price is stable, then the Donchian channel will be narrow, But if the price fluctuates often, then the channel will be wider.
You can also watch my video on Intraday trading below:
Bottomline
As discussed above, these technical indicators can be used for intraday trading but one should also remember that they should not trade based on only one intraday technical indicator. One should set up their intraday trading strategy and use a combination of these indicators. For example, one can combine a momentum indicator with volatility and volume indicators. This way, the signal given by one indicator can be confirmed with other intraday trading indicators.
Frequently Asked Questions (FAQs)
Why use indicators in intraday trading?
Traders can assess market circumstances, spot trends, and arrive at well-informed conclusions with the aid of indicators. They offer perceptions into fluctuations in price, volatility, and possible points of entry and exit.
How do Moving Averages work in intraday trading?
To produce an indicator that follows trends, price data is smoothed out using moving averages. They are used by traders to determine probable reversal points and the general trend direction. Simple Moving Average (SMA) and Exponential Moving Average (EMA) are two popular varieties.
You can also visit web.stockedge.com, a unique platform that is 100% focused on research and analytics.


This blog content is useful for beginners like me who wants knowledge about Indian Stock Market and intraday. Thank you so much for this
Hi,
We really appreciated that you liked our blog.
Keep Reading!
Very useful info
Hi,
We really appreciated that you liked our blog! Thank you for your feedback!
Keep Reading!
Good Information
Hi,
We really appreciated that you liked our blog! Thank you for your feedback!
Keep Reading!
It is very useful content to us I heartly appreciate you and hope for several content like this. Thanks a lot .
Hi,
We really appreciated that you liked our blog! However, there is no option to download the same.
Thank you for Reading!
Keep Reading!