Join Courses
Attend Webinars
Get Free Counselling
  • Select Language
    • Hindi
    • Bengali
+91 9903 222 555
Elearnmarkets - Financial Market Learning
Join Courses Of Elearnmarkets
  • Basic Finance
  • Technical Analysis
  • Fundamental Analysis
  • Derivatives
  • Financial Planning
  • Miscellaneous
No Result
View All Result
  • Basic Finance
  • Technical Analysis
  • Fundamental Analysis
  • Derivatives
  • Financial Planning
  • Miscellaneous
No Result
View All Result
Elearnmarkets - Financial Market Learning
Home Technical Analysis Market Analysis
Hourly Chart

A Doji Candle With Negative Divergence In The RSI, Correction Is Expected

Elearnmarkets by Elearnmarkets
August 25, 2018 - Updated on November 18, 2020
Reading Time: 3min read
0
462
VIEWS
Share on FacebookShare on TwitterShare on LinkedIn

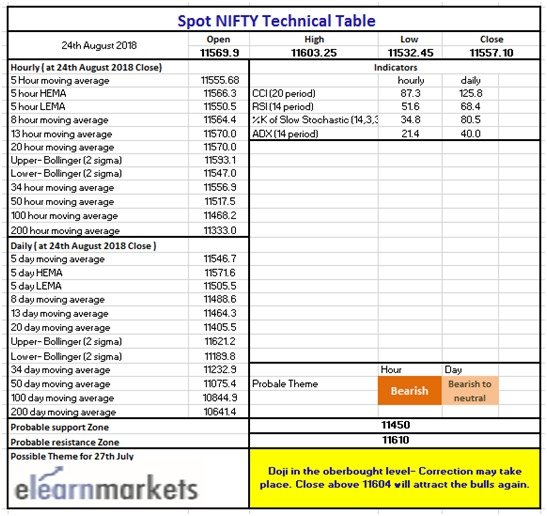
Nifty close 11557.10: Nifty made a Doji candle in the daily chart where the indicator RSI showing negative divergence.

We have seen that Nifty has made a new high (approximately 11612.15) in this week (Previous high was 11495.20). The week started with a gap up opening above 11500 level which was very positive but at the end sessions it made two consecutive red candles in the daily chart.

Market is trading at its lifetime high and the Doji candle in the overbought area (Stochastic Indicator) suggesting there is a chance of market correction.

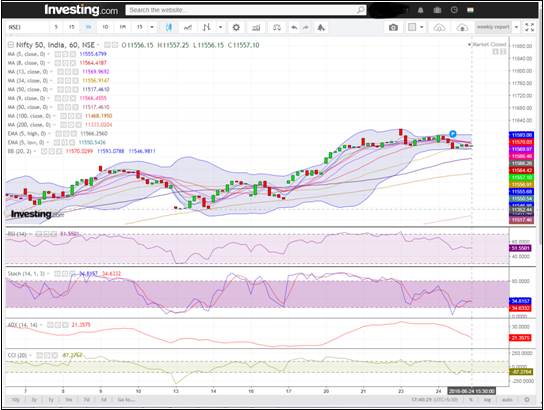
Hourly Technical: In the Hourly chart of Nifty it is trading flat and if we notice we could see there are three Doji candles in the daily chart. So it is pretty much obvious that Buyers are not so much confident to take the price higher and the bears are waiting for the right signal.

Indicator in the hourly chart suggesting that market is in a range bound zone. RSI is at approximately 51 levels, Stochastic is at 34 (approx.), ADX falling sharply and it is at 21 (approx.) and CCI is at -87 (approx.).

So overall indecision is playing in the market. In case market moves higher 11600 level is going to be the next resistance and for the support it would be 11450.

Nifty Hourly Chart

(Hourly chart)

Daily Technical: As we mentioned earlier there is negative divergence visible in the RSI indicator and in the last trading day, the index made a Doji candle. Stochastic is also in the overbought this time so there is chance of correction.

Most of the indicators are below the price level, so huge down side risk is very less because of this MA lines will be acting as a support in case of any short fall.

Let’s discuss the indicators, Indicators are slopping down, RSI is below 70, Stochastic is at 80 (approx.), ADX is at 40, CCI is at 125 level (approx.)

So indicators are also in a phase of correction and we are also expecting correction in the price for next week.

In daily chart Resistance is at 11610 level and the support is 11480 level.
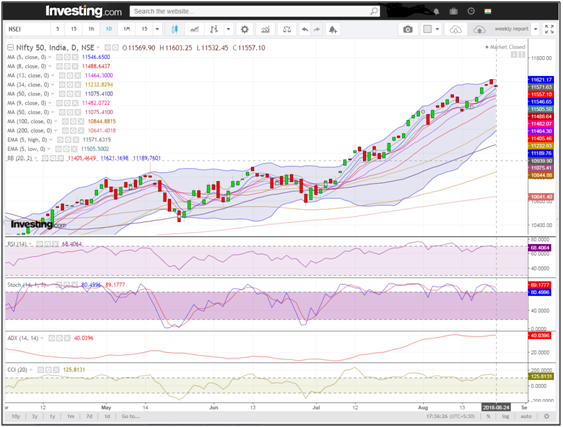
Nifty Daily Chart

(Daily chart)

Weekly Technical: In the weekly chart there is nothing negative it is just that price is trading in the overbought level if any correction takes place it would be regular correction as per our expectation.

There is other possibility as well which is, market may move up farther despite being traded in the overbought level. If market goes up in the next trading sessions, we may expect 12000 mark very soon.

As we mentioned indicators are in the overbought level. RSI is above 75, stochastic is above 95 level, ADX is trending up and it is above 20 level and CCI is above 160 level.

So overall the bullish sentiment is intact in the market and in case of correction, it is part of market’s cycle and it may appear due to the overbought level.

But in the long term we are expecting the existing sentiment will be intact.
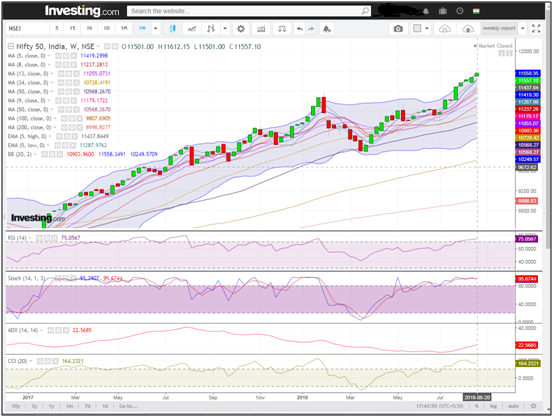
Nifty Weekly Chart

(Weekly chart)

You can use stockedge app to get cutting edge over others in both short term trading and investing. Here you not only get data at one particular place but can also create your own combination scans based on your own technical and fundamental parameter. See the video below to know about various features in Stockedge app.

Nifty Technical Chart

(Technical Chart)


Tags: english
ShareTweetShare
Subscribe To Updates On Telegram Subscribe To Updates On Telegram Subscribe To Updates On Telegram
Previous Post

How Open Interest Analysis helps to identify market trends?

Next Post

Your Online Life Insurance Quote simplified – Everything you need to know

Elearnmarkets

Elearnmarkets

Elearnmarkets (ELM) is a complete financial market portal where the market experts have taken the onus to spread financial education. ELM constantly experiments with new education methodologies and technologies to make financial education effective, affordable and accessible to all. You can connect with us on Twitter @elearnmarkets.

Related Posts

Hourly Chart
Market Analysis

Nifty Washes Off Three Day’s Gain, Closes Below 11500

March 22, 2019 - Updated on November 18, 2020
401
Market Wrap

Nifty breaks the consolidation phase, up approx. 360 points

March 16, 2019 - Updated on November 18, 2020
95
Hourly Chart
Market Analysis

Nifty Made A Close Above 11000. Is The Consolidation Over?

March 9, 2019 - Updated on November 18, 2020
67
Hourly Chart
Market Analysis

Nifty Ends In Green Amid Geopolitical Tension

March 2, 2019 - Updated on November 18, 2020
53
Next Post

Your Online Life Insurance Quote simplified - Everything you need to know

Hourly Chart

Nifty Makes New High Despite Rupee Trading In A Life Time Low

Nifty Hourly Chart

Nifty Closes On Positive Note Despite Of Higher Crude Prices And Weak Rupee

Leave a Reply Cancel reply

Your email address will not be published. Required fields are marked *

Follow Us

Download App

Register on Elearnmarkets

Continue your financial learning by creating your own account on Elearnmarkets.com

Register Free Account

GET ARTICLES ON EMAIL

Enter your email address:

Categories

  • Banking
  • Basic Finance
  • Bonds & Fixed Income
  • Budgeting & Savings
  • Capital Markets
  • Charts
  • Charts, Patterns & Indicators
  • Commodity, Currency & FOREX Market
  • Derivatives
  • ETFs & Mutual Funds
  • Financial Planning
  • Financial Statement Analysis
  • Fundamental Analysis
  • Macroeconomics
  • Market Analysis
  • Market Updates
  • Market Wrap
  • Marketshala
  • Miscellaneous
  • Open Interest
  • Personal Wealth
  • Retirement Planning
  • Sector Analysis
  • Tax Planning
  • Technical Analysis
  • Trading Terms, Rules & Strategies
  • Visit Elearnmarkets
  • Courses
  • Webinars
  • Financial Guides
  • Get Free Counselling

© 2020 Elearnmarkets All Rights Reserved

No Result
View All Result
  • Article Categories
  • Basic Finance
  • Derivatives
  • Financial Planning
  • Fundamental Analysis
  • Market Analysis
  • Miscellaneous
  • Technical Analysis
  • Select Language
    • Hindi
    • Bengali
  • Learn finance
  • Browse Courses
  • Webinars
  • Free Guides
  • Get Free Counselling

© 2020 Elearnmarkets All Rights Reserved