Welles Wilder developed the Average Directional Index (ADX) indicator, which measures trend strength and shows trend direction.
The ADX indicator tells traders whether the bulls or bears are in control of the market. The ADX is derived from the Positive Directional Movement Indicator (+DMI) and the Negative Directional Movement Indicator (-DMI) (-DMI).
The ADX indicator is a hybrid of two other Wilder indicators: the positive directional indicator (abbreviated +DI) and the negative directional indicator (abbreviated -DI) (-DI). The ADX combines them and smoothes the resulting moving average.
Using the +DMI and -DMI indicators, as well as the ADX, this system attempts to measure the strength of price movement in bullish and bearish markets. It is effective in both trending and range-bound markets.
Let us discuss some trading strategies using this indicator:
What is the Average Directional Index (ADX) Indicator in Stock Market?
J. Welles Wilder, a technical analysis legend, invented the ADX (Average Directional Index). Wilder was clearly attempting two things with the ADX indicator:
- When the market is trending, notify a trader.
- To stay on the right side of the market, filter out counter-trend trades.
The ADX is a single-line oscillating indicator that ranges from 0 to 100. The ADX only indicates the strength of the trend and not its direction. In other words, the ADX is a non-directional indicator, which means it measures the strength of a trend but does not differentiate between uptrends and downtrends. As a result, the ADX rises during a strong uptrend and falls during a strong downtrend.
How does this Indicator work?
The ADX indicator of trend strength is as follows:
- When the ADX is greater than 25, the trend strength is sufficient for trend-following strategies.
- When the ADX is less than 25, traders should avoid using trend trading strategies because the market is in an accumulation or distribution phase.
- ADX measures the strength of an uptrend when it is greater than 25, and the +DMI (positive directional movement index) is greater than the -DMI (negative directional movement index).
- ADX measures the strength of a downtrend when it is greater than 25, and the +DMI is greater than the -DMI.
- ADX values greater than 50 indicate a very strong trend.
Trading Strategies Using ADX
Let us discuss some trading strategies using ADX:
1. ADX and On-Balance Strategy
A common way to take entries with the ADX indicator is by spotting the DI crossovers:
- the +DMI green line crossing above the –DMI red line, suggest an uptrend.
- the +DMI green line crossing below the –DMI red line, suggest a downtrend.
This strategy is not enough to be profitable, as it will offer a lot of false signals. It’s better to be used in conjunction with other indicators. I personally prefer to filter the entries with the on balance volume.
On Balance Volume (OBV) is a momentum indicator that relates volume to price change. On Balance Volume indicator shows if the market’s volume is flowing into or out of a security/stock.
We thus combine the strength of a trend (ADX) with momentum (OBV).
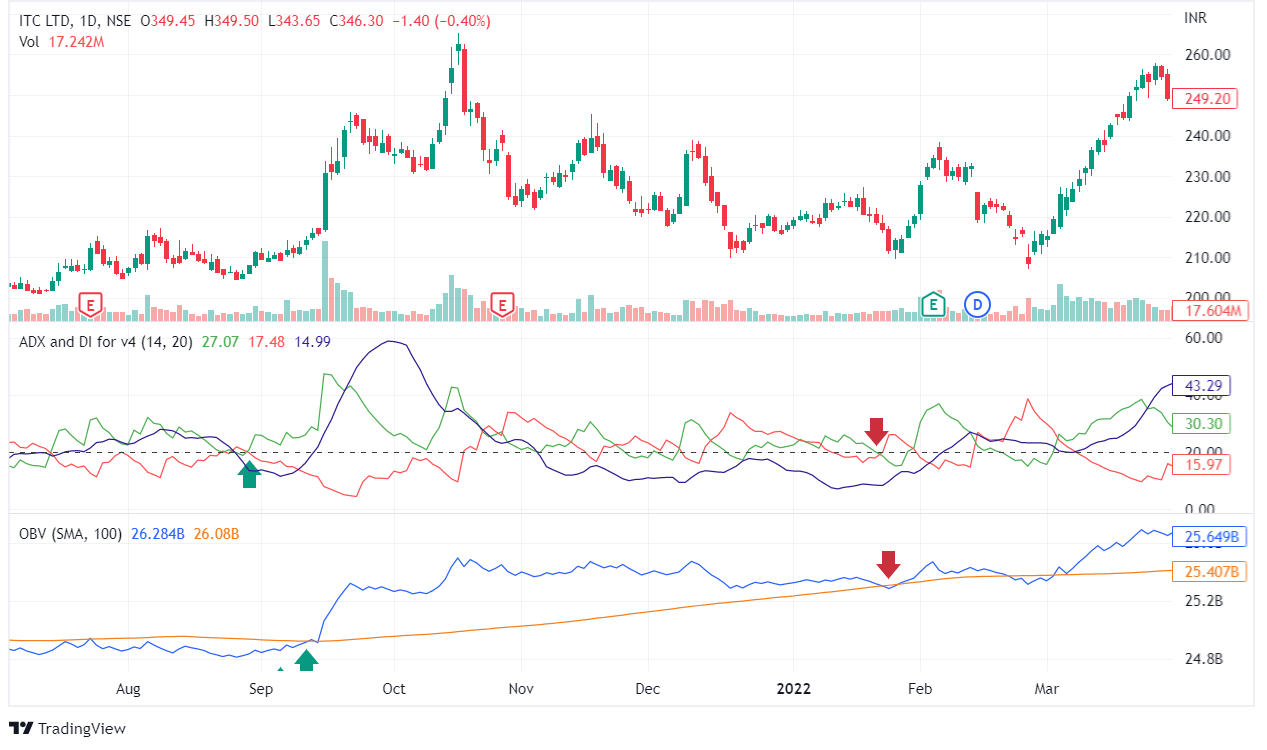
We went long when the +DI green line crossed above the -DI red line and the OBV crossed above the MA100.
We also had a valid sell signal during this time, with the +DI green line crossing below the -DI red line and OBV falling below MA100.
This is a strong setup that works on longer timeframes.
2. ADX with Parabolic SAR
This second strategy now expands on the DM system.
At times, the price action appears to contradict the ADX. Using DI crossovers for entries may not make sense in such cases. According to Wilder, using the system in conjunction with the Parabolic SAR can result in a better entry.
It works as follows:
- To determine your market bias, use the DM system.
- For trade triggers, look to the Parabolic SAR.

As shown in the chart above, when a nice parabolic swing occurs, the Parabolic SAR can even guide your exit from the market.
3. ADX Price Divergence
The fundamental intuition behind this strategy is that the ADX value should rise as a trend develops. But what if the ADX is falling rather than rising? What does this imply?
This divergence indicates that the ADX is warning against the trend. It is similar to oscillator divergences such as the RSI and MACD.
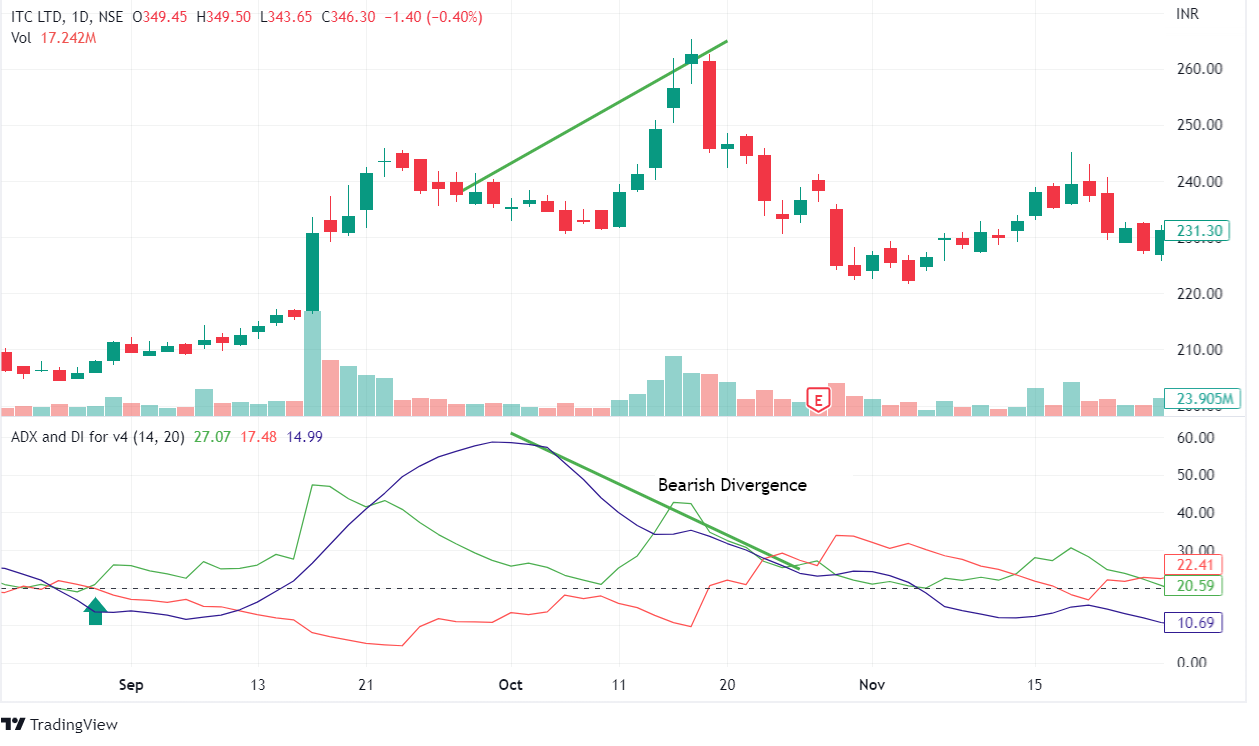
One important distinction is that the ADX is not directional on its own. This attribute has a direct impact on how you search for ADX price divergences.
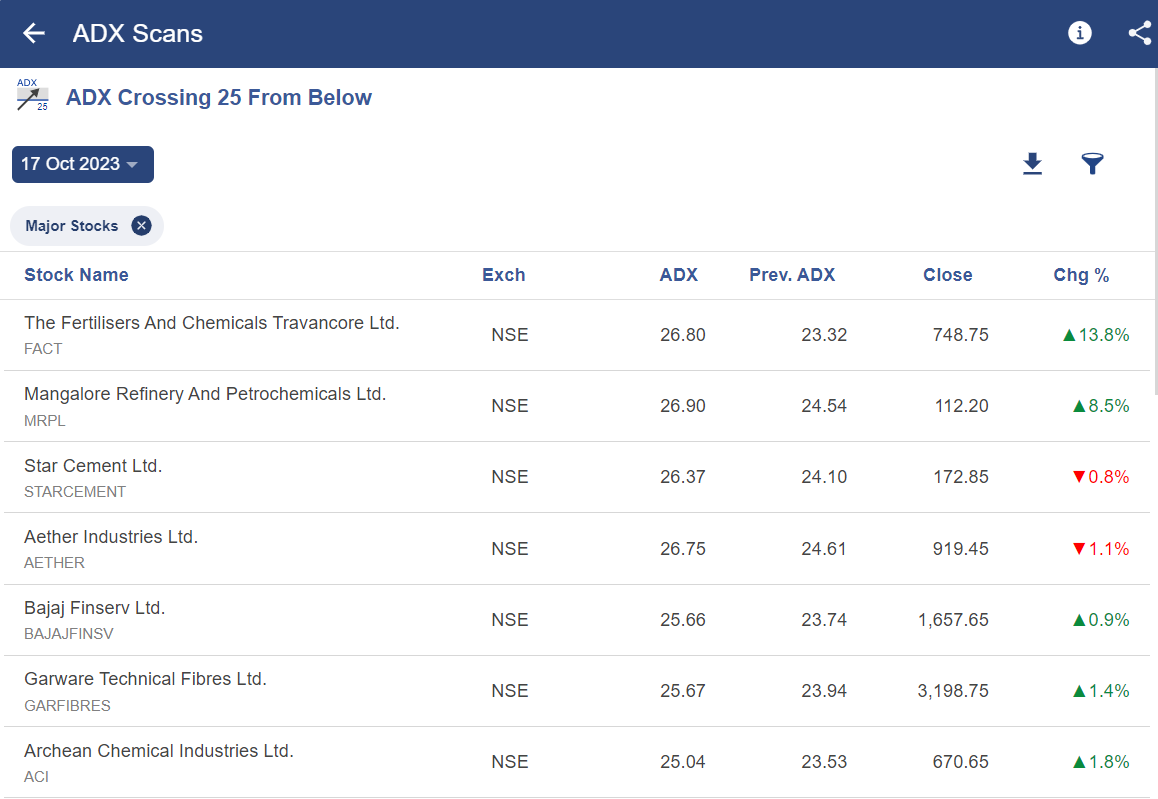
Using StockEdge for ADX Screener:
StockEdge has many ADX scans which help us to filter out stocks for trading as shown below:
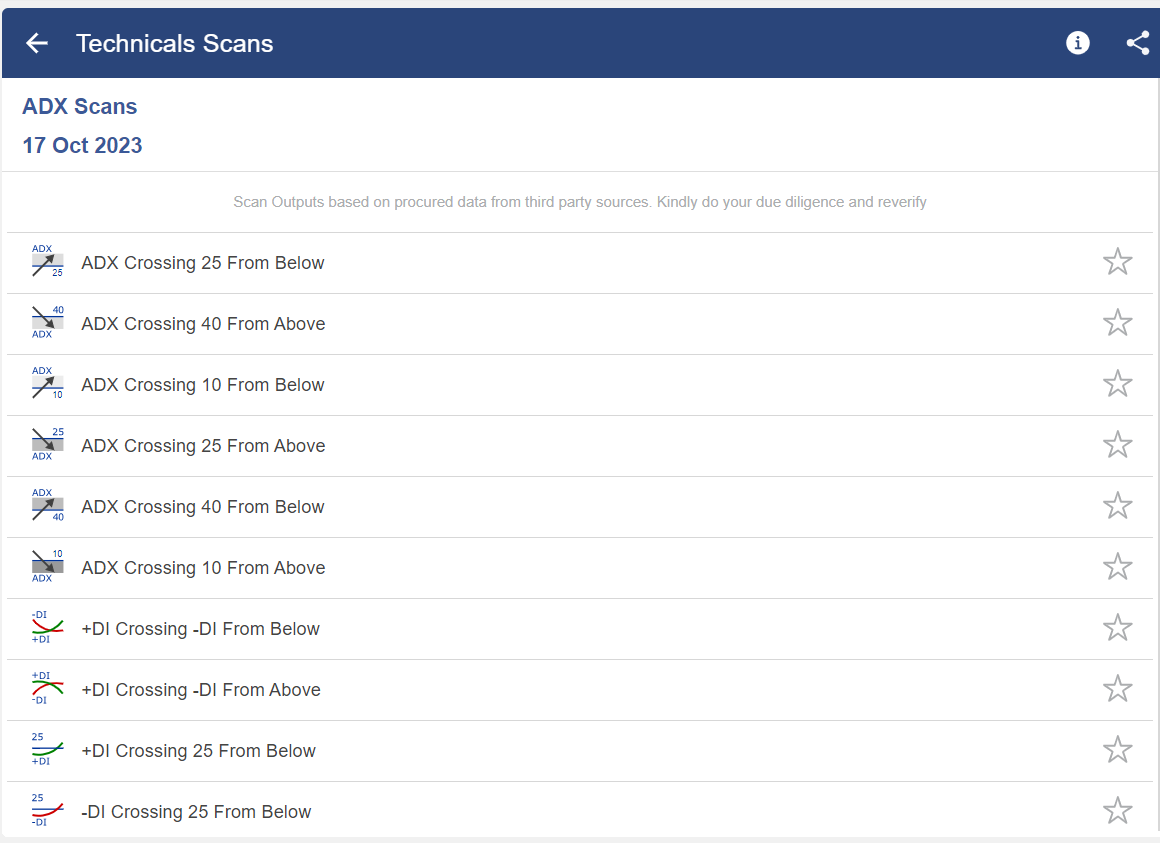
With the help of these scans, one can filter our stocks as shown below:
Bottomline
ADX is a leading indicator that predicts where to buy and sell stocks to maximise profits.You can double your accuracy and get good results by using this simple technical analysis tool. It is used in the stock market by both short-term and long-term traders.
Frequently Asked Questions (FAQs)
What is a good average directional index?
The ADX ranges from 0 to 100, where values below 20 denote a weak trend and values above 50, a strong trend.
Is ADX a good indicator?
The Average Directional Index, or ADX, is a technical analysis indicator that quantifies the strength of a market trend. A reading above 25 indicates a strong trend, whereas one below 25 indicates a weak trend. The scale goes from 0 to 100.
What is the difference between average true range and average directional index?
ATR is frequently used to calculate risk and potential return, as well as to determine stop-loss and take-profit levels. An indication of trend strength, the Average Directional Index, or ADX, quantifies how strong a trend is in a certain security.


