
An option chain often called an options matrix, is a list of all potential options contracts for a particular security. Within a particular maturity period, it displays all listed puts and calls, as well as their expiration dates, strike prices, and volume and pricing information for a single underlying asset.
So in today’s blog, we will discuss The Smart Way to become an Option Chain Expert in 30 min. If you want a practical understanding of becoming an expert in option chain analysis, watch the full video at the end of this blog.
What is Option Chain?
The option chain is a matrix where we analyze which call or put strike price trading is happening, open interest, premium, and average prices of the particular instrument of the particular series are shown on one page.
How to analyze Option Chain?
Whenever you want to see the options chain of a particular instrument you need to go to the NSE website or StockEdge:
Below is the option chain of Nifty:
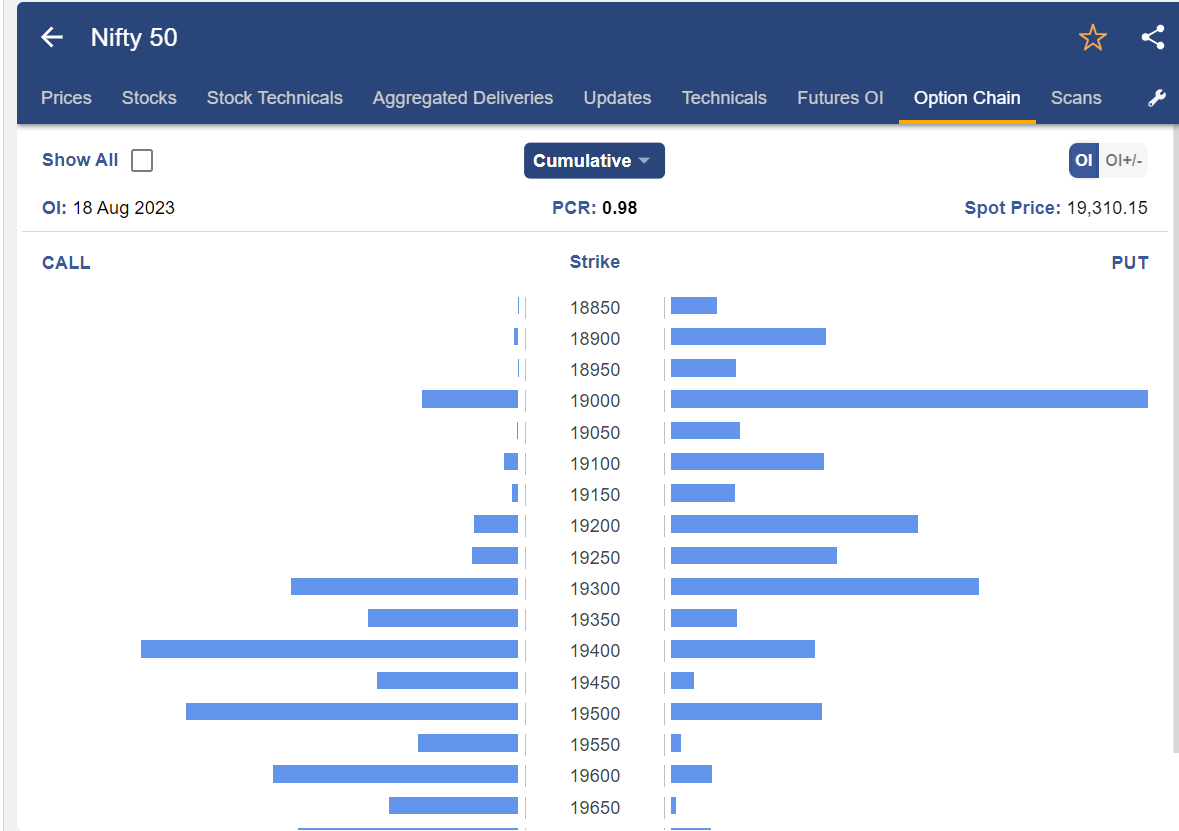
We can see the expiry series; one should note that weekly and monthly expiries are available for Nifty and Bank Nifty.
When we come below we can see on the option chain table are Call and Put written.
The buyer of the call has the right but does not have an obligation to buy the contract. If the price goes above the strike price, then the call’s buyer will profit. If the price goes below the strike price, then the loss will equal the premium paid.
Similarly, Puts are the right to sell an asset but do not have an obligation to do so at a particular strike price. If the price goes below the strike price, then the put buyer will profit. If the price goes above the strike price, the loss will equal the premium paid.
Then we can see the open interest, volume, LTP, and strike price of both call and put options which are important parameters to depict the option chain.
How to analyze the Option Chain of Nifty or Bank Nifty Option Chain Open Interest?
From all the data, the open interest is the most important column in the options chain as we need to analyze it from the seller’s perspective.
Open Interest means the number of contracts that are open for trading.
One should notice the strike price in which the open interest is maximum.
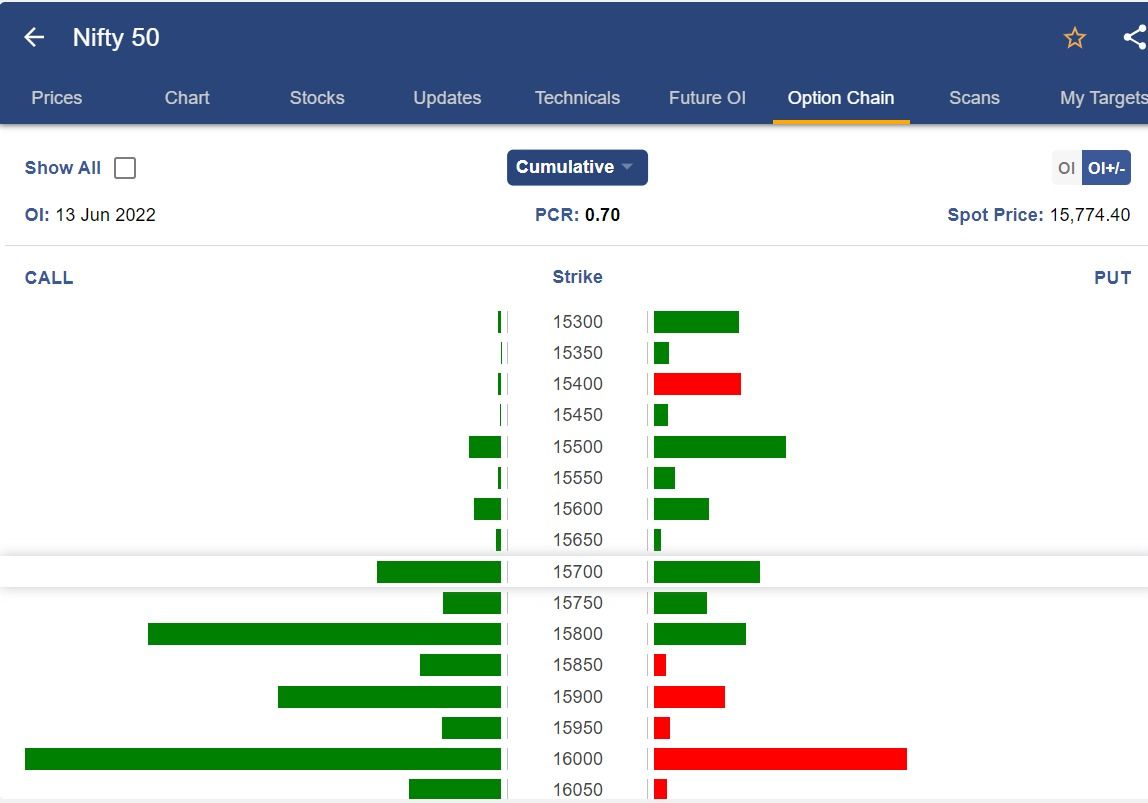
We can see from the above screen of option chain that at the strike price of 16,000 the open interest is maximum.
As we can see in the option chain of Nifty that the change in the open interest is negative, we can determine that the option buyer is incurring a loss at that strike price, and the options seller is making a profit.
We need to see the average price, so we click on the LTP.
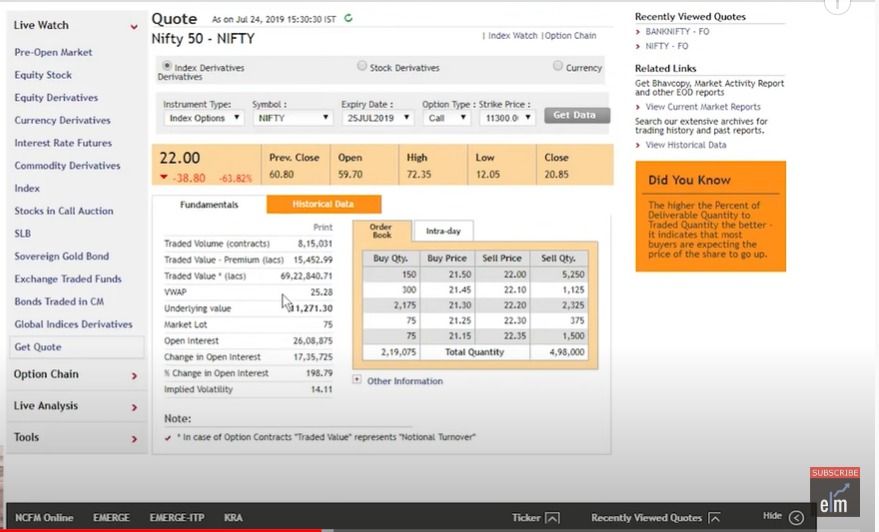
We can see at the average price i.e. VWAP OF Rs. 25 which means that till this price the options sellers were aggressively selling.
So we can say that 11325, i.e. strike price+ VWAP will be the strong resistance.
Now let us go to the daily chart of Nifty, from where we can see that 11,300 is an important low psychological level.
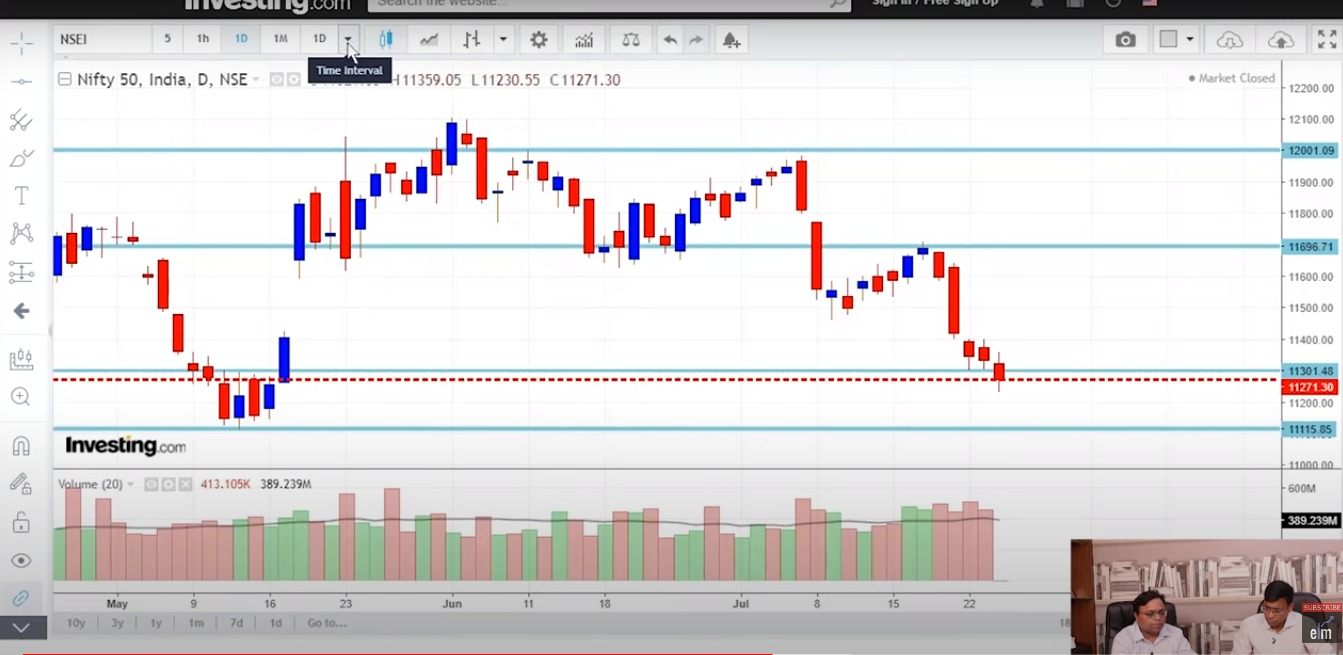
We can also see that the market broke the level of 11,300 to the downside and call writers became aggressive.
Now at the same strike price, we need to see what put writers are doing are supporting 11,300 or not.
For this, we can go back to the option chain and see that the put writers had cut their position at the same strike price.
Now let us go to the 15-minute chart of Nifty to determine when the put writers cut their position.
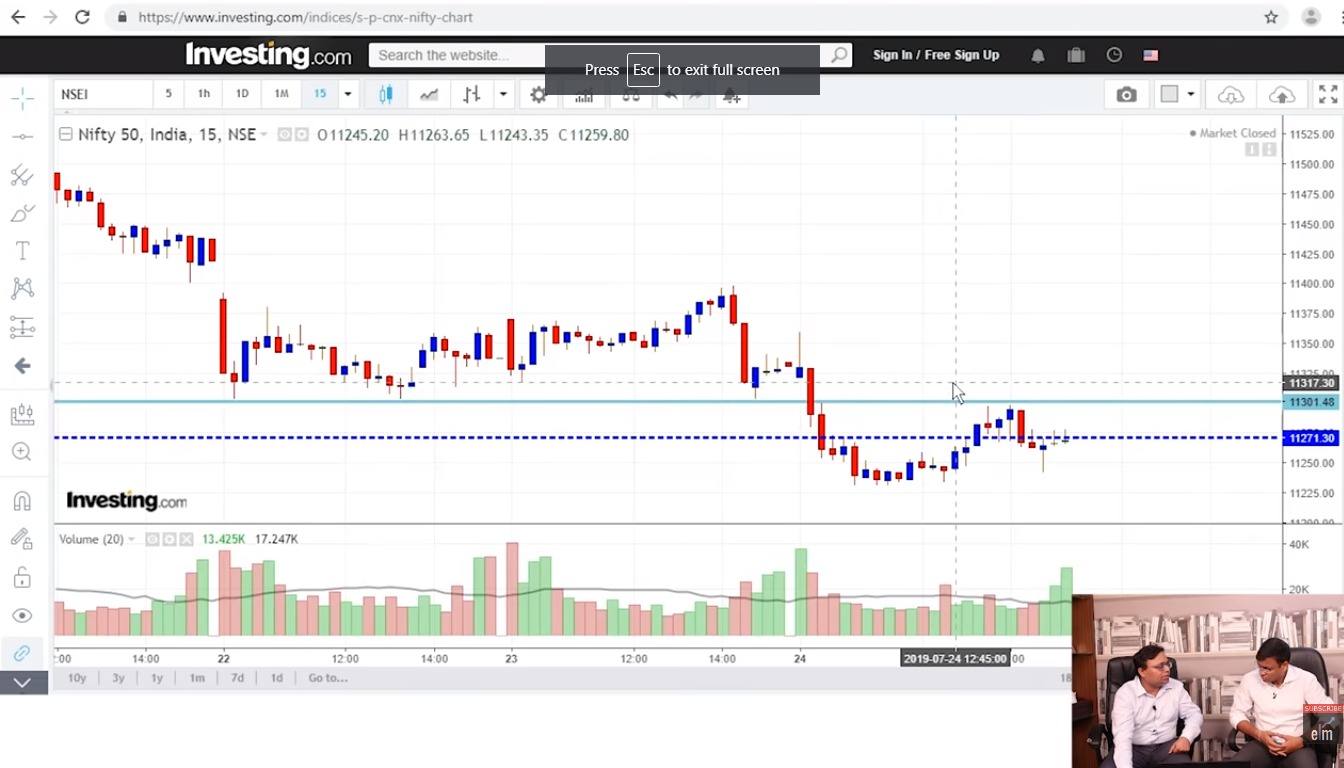
We can see at the beginning of the trading session only, that prices fell and broke the 11,300 level, the buying again came but wasn’t able to cross that price.
So level 11,325 is an important level for the call writers for tomorrow’s expiry.
If the market does not sustain above 11, 325 then there will be more of bears’ grip.
You can watch the full video here:
So we can conclude that if we combine the chart with the option chain study then we can get a different level of conviction.
Bottomline
At first glance, options could appear to be rows of random numbers. Option chain charts are a useful tool for learning about a security’s present value and potential future changes. Investors can become more knowledgeable and make better decisions in the market by understanding how an options chain works.
Ready to master option chains? Elevate your skills with our Option Trading Course. Start your journey to expertise today!
Frequently Asked Questions (FAQs)
What is Option Chain?
A complete list of every option (put and call) that can be traded on a specific underlying asset, such as stocks, currencies, commodities, or indices, is known as an option chain. For various strike prices, it gives information on premium, volume, open interest, etc.
What is Option Chain Analysis?
A full list of all put and call options (both accessible for trading on a specific underlying asset, such as stocks, currencies, commodities, or indices) is known as an option chain. It includes information on premium, volume, open interest, and other factors for various strike prices.


