
What exactly do we mean when we talk about market breadth? The Market Breadth reflects the participants in the market.
It can be construed in a number of different ways. The number of stocks participating in a rally can be calculated using breadth. The number of active investors in the market can also be deduced from breadth.
But why is market breadth so important?
The fundamental question whenever the markets rally is whether the rally is sustainable. The size of the marketplaces determines this.
A market rally is usually accompanied by market bread, which is thought to be more sustainable. On the other hand, if the market has been rallying with diminishing width, this is interpreted as a sign of waning confidence in the market.
So, in today’s blog, we will discuss how to interpret market breadth indicators with the help of StockEdge:
What is meant by Market Breadth Indicator?
Breadth indicators help traders and investors gauge the overall view of the market. The movement in the stock market is examined by using stock indexes.
For example, the Nifty 50 Advance/Decline Line is a cumulative guide that helps us understand whether more stocks are rising or falling over time.
This calculation helps us analyze the overall investor sentiment in all the stocks within the index.
Breadth indicators are mainly used for two purposes:
- Market Sentiment: These indicators can help us determine if the ongoing trend of the market will reverse.
- Trend Strength: Breadth indicators can also help us determine the Strength of a bullish or bearish trend.
Market Breadth Indicators
1. Percent/Number of Stocks above Moving Average
A breadth indicator gauges internal Strength or weakness in the underlying index by the percentage of stocks trading above a specified moving average.
Short-to-medium-term periods are covered by the 50-day moving average, while the 150-day and 200-day moving averages cover medium-to-long-term timescales.
Overbought/oversold levels, crossovers above/below 50%, and bullish/bearish divergences can all be used to generate signals.
A bullish bias is present when the indicator is above 50%. This means more than half the stocks in the index are above a particular moving average. Conversely, a bearish bias is present when below 50%.
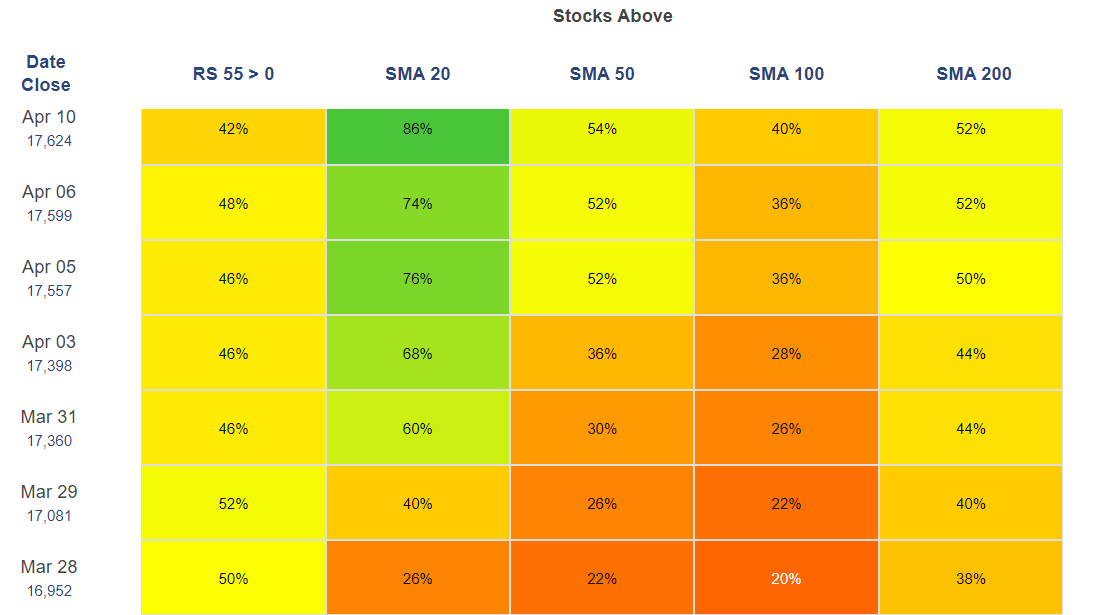
From the above Market Breadth chart in StockEdge , we can see that all the SMAs – 20-50-100-200 are below 50%, indicating that the market right now is in the bearish zone.
2. Percent/Number of Stocks above Relative Strength 55
A breadth indicator also gauges internal Strength or weakness in the underlying index by the percentage of stocks trading above a specified relative strength period.
Relative Strength refers to the measurement of the stock’s performance as compared to its benchmark or another stock.
RS compares the performance of stock “X” vs “Y”, measured over a period. For example, “X” may increase more or less than “Y” in a rising market, or “X” may fall more or less as compared to “Y” in a falling market.

A bullish bias is present when the indicator is above 50%. This means more than half the stocks in the index are outperforming the index. Conversely, a bearish bias is present when below 50%.
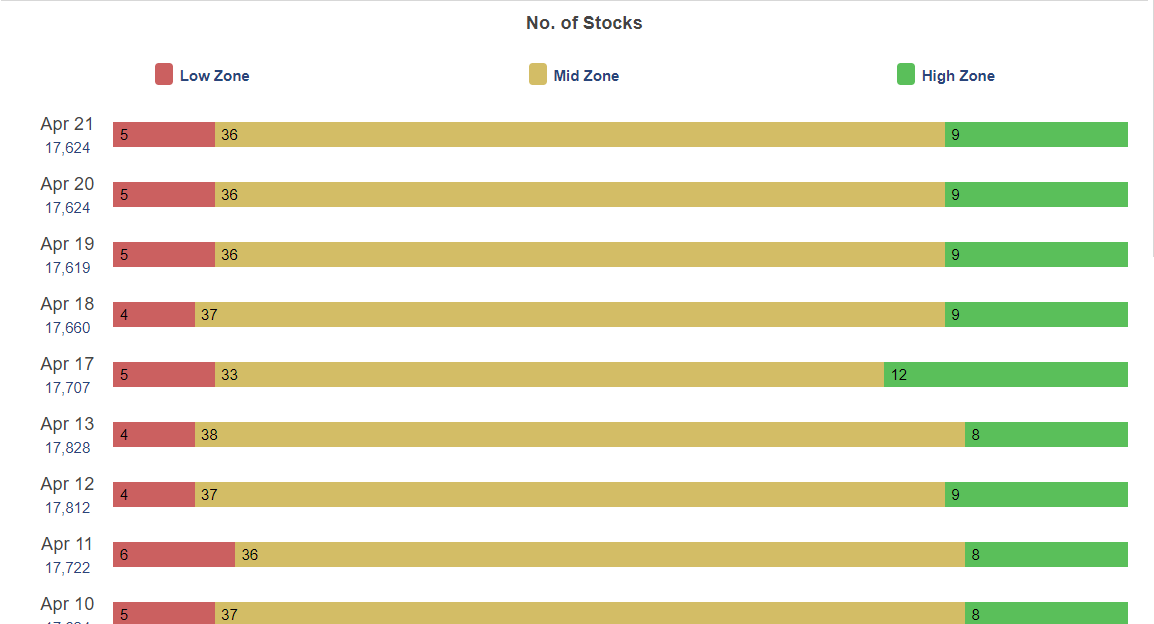
3. Periodic High and Low
The high and low levels in a specific period are referred to as periodic highs and lows. Users can see the number of stocks trading around their periodic high or low for various periods.
When securities trade at a price within 20% of its High-Low range, it is eligible to be included in the Period High/Low Analysis.
From the above bar chart, we can see that the number of stocks is increasing in the low zone and decreasing in the high zone, indicating a bearish bias in the market.
4. Advance/Decline
The advance-decline ratio refers to the number of advancing shares divided by the number of declining shares. The advance-decline ratio can be used for various timeframes, such as one day, one week or one month.
This indicator indicates whether the market is overbought or oversold on a standalone basis.
The bar chart shows the advance/decline for Nifty 50 / Nifty 500 for different time periods.
If advances are greater than declines consistently, an uptrend is indicated and if declines are greater than advances consistently, a downtrend is indicated.
As the number of Advances increases, it indicates that stocks are performing better comparatively, and an overall uptrend will come by.
5. Net New High and Net New Lows
Net New 52-Week Highs is a simple breadth indicator which is calculated by subtracting new lows from new highs.
“New lows” is the number of stocks recording new 52-week lows, and “New highs” is the number of stocks making new 52-week highs.
This indicator provides help in gauging the internal Strength or weakness in the market.
It indicates that there are more new highs when the indicator is positive. On the other hand, there are more new lows when the indicator is negative.
You can also take our course on CERTIFICATION IN ONLINE TECHNICAL ANALYSIS to learn more about Technical Analysis
Bottomline
One should note that the breadth indicators can only be calculated on indexes and not on a particular stock. However, depending on the data available, these indicators can be calculated to analyze the market strength of the stock market.
Traders should use market breadth indicators with other technical analysis tools, such as chart patterns and technical indicators, to maximize the odds of success.
We hope you found this blog informative and use it to its maximum potential in the practical world. Also, show some love by sharing this blog with your family and friends and helping us in our mission of spreading financial literacy.
Happy Investing!


