
Hindi: आप इस लेख को हिंदी में भी पढ़ सकते है|
It is extremely important to have a basic understanding of the candlestick chart patterns to help us in quickly understand the direction of price movement.
Under technical analysis, a candlestick chart pattern is one of the most efficient ways to analyze the change in the prices of an asset.
One of the reasons for the popularity of candlesticks charts is that they are more visually appealing than the bar and line charts.
For a trader, two of the most favorite features of candlesticks charts are:
Each candlestick shows the completion of a specific number of trades during a particular period.
It also shows that if there was more selling pressure or buying pressure during that particular period.
In this blog, let us discuss in detail about candlestick chart patterns and how to analyze them while trading:
| Table of Contents |
|---|
| Origin of Candlesticks |
| Formation of Candlesticks |
| Interpreting Patterns on Candlestick Charts |
| Three Assumptions while analysing the Candlestick Charts |
| Key Takeaways |
Origin of Candlesticks:
Japanese candlesticks chart patterns are the oldest type of charting technique used to analyze the future price movement.
In the 1700s, the earliest forms of candlestick charts were used to predict rice prices.
In 1750, a Japanese merchant by the name of Munehisa Homma started using his candlestick chart analysis to trade at the Rice exchange at Sakata.
Suggested Read: All you need to know about the Japanese Candlestick
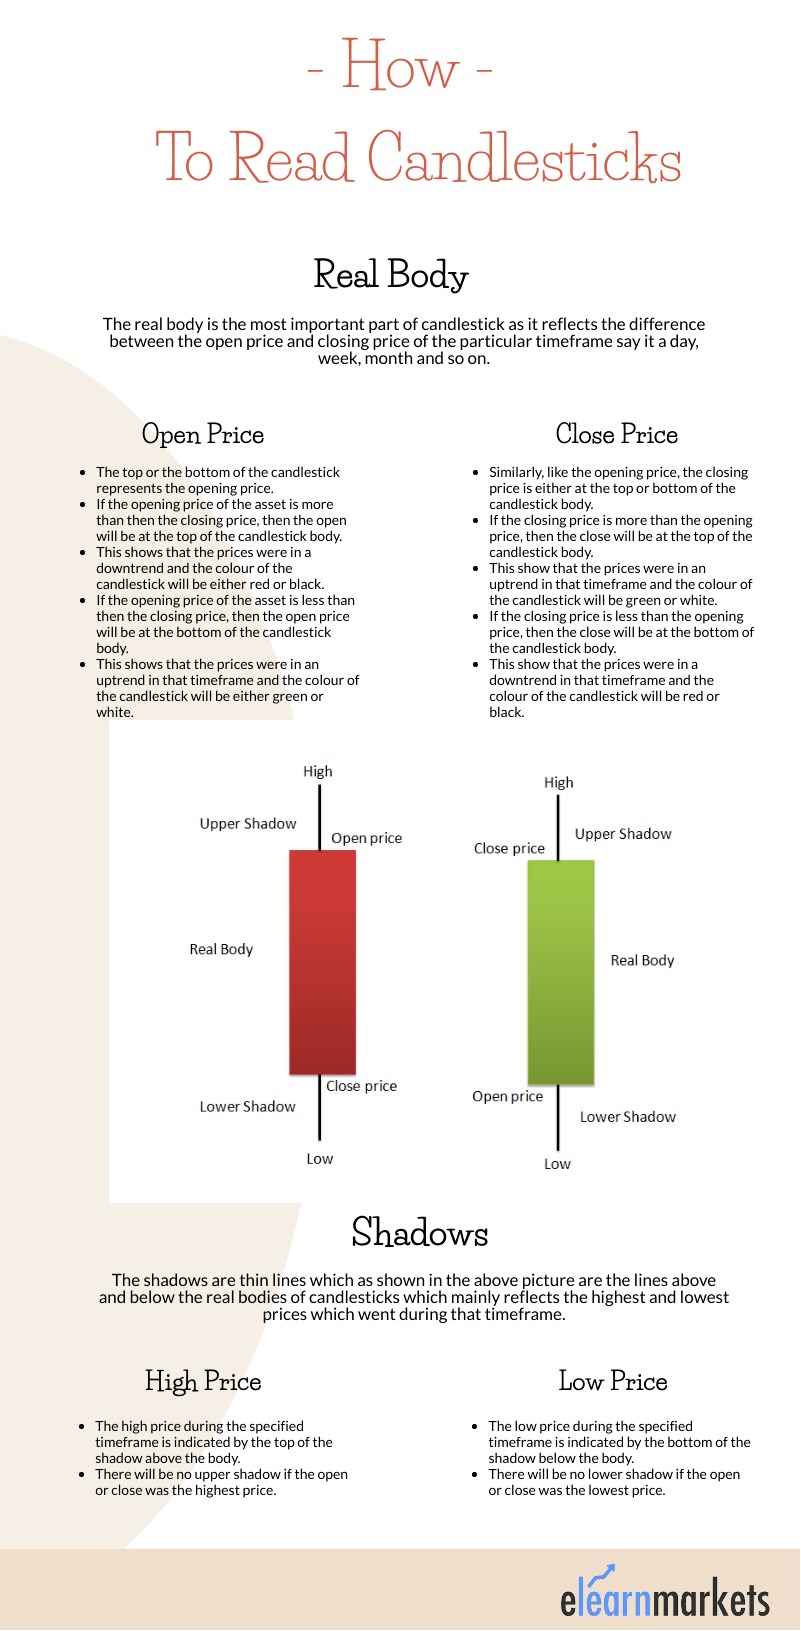
Formation of Candlestick Chart Pattern :
Each candlestick chart pattern is mainly made up of real body and wicks also known as shadows or tails:
Suggested Read: How Heikin Ashi charts help to filter the trade
Suggested Webinar: Trend Following with Heikin Ashi Candlesticks
Interpreting Patterns on Candlesticks Charts:
As candlestick chart patterns are more appealing, the trader looks for candlestick patterns that can be continuation or reversal.
Candlestick chart patterns can also be classified into bearish and bullish candlestick patterns.
The candlestick patterns can be a single candlestick pattern or may be formed by grouping two three candlesticks.
Some of the examples of such candlestick patterns are listed below –
Multiple candlestick patterns are formed by multiple candles.
Example of multiple candlestick patterns:
o Bullish Engulfing
o Bearish Engulfing
o Bullish Harami
o Bearish Harami
Three Assumptions while analysing the Candlesticks Charts :
1. One should buy strength and sell weakness:
Strength is usually represented by a bullish (green) candle whereas weakness is represented by a bearish (red) candle.
Learn from Experts : Trade Better with Candlesticks
One should usually buy on a green candle day and sell on a red candle day.
2. One should be flexible with patterns:
There could be minor variations to the pattern because of market conditions.
Therefore, one should be a bit flexible when analysing these candlestick patterns on the charts.
3. One should look for a prior trend:
The prior trend should be bearish when looking for a bullish candlestick pattern and similarly, the prior trend should be bullish if you are looking for a bearish pattern.
You can also watch the video below to know more about candlesticks:
Frequently Asked Questions
Which candlestick pattern is most reliable?
Candlestick Patterns like Abandoned Baby, Evening and Morning Star, Three Black Crows are most eligible.
What is bearish reversal?
A bearish reversal happens when an upward trend ends and starts to move in the opposite direction.
What do long wicks mean in trading?
Wicks or shadows above or below the candlesticks indicate high and price respectively
How can a trader confirm a candlestick reversal using indicators?
A trader can confirm a candlestick reversal using indicators when the indicators give the same reversal signals
What are a few common mistakes made while trading candlestick patterns?
The most common mistake is looking at candlestick pattern in isolation as a standalone system. When trading with the candlesticks traders should also look at the indicators.
Key Takeaways:
Candlestick charts are a type of technical charts which analyses further price movement similar to the bar charts or line charts.
Each candlestick is mainly made up of real body and wicks also known as shadows or tails.
The opening price of the asset > closing price = Open will be at the top of the candlestick body.
The closing price of the asset > opening price = Close will be at the top of the candlestick body.
As candlesticks are more appealing, the trader looks for candlestick patterns which can be continuation or reversal patterns.


