Identifying patterns is one of the biggest tasks for any trader in the stock market. This is where candlestick patterns and chart patterns can be extremely useful.
Therefore knowing the difference between these two types of technical tools is important for trading using Technical analysis.
Candlestick charts are technical tools that pack data for multiple time frames into single price bars.
Whereas chart patterns are the building blocks of technical analysis. They repeat themselves in the market time and are relatively easy to spot.
| Table of Contents |
|---|
| What is Candlestick pattern? |
| Basic Candlestick Patterns |
| What is Chart pattern? |
| Key Takeaways |
Let us first understand these technical tools:
What is Candlestick pattern?
Candlesticks show emotion visually by representing the size of price moves.
Traders use candlesticks for making trading decisions that are based on regularly occurring patterns that help to forecast the short-term direction of the price.
These are Japanese candlestick had their origins in the centuries-old Japanese rice trade and then made their way into modern-day price charting.
Some investors find them more appealing than the standard bar charts as the price actions are easier to interpret.
Candlesticks are so known because of their rectangular shape and lines on either end which resembles a candle with wicks.
Each candlestick represents one day’s worth of price data about a stock.
The candlesticks are grouped into recognizable patterns which investors can use for making buying and selling decisions.
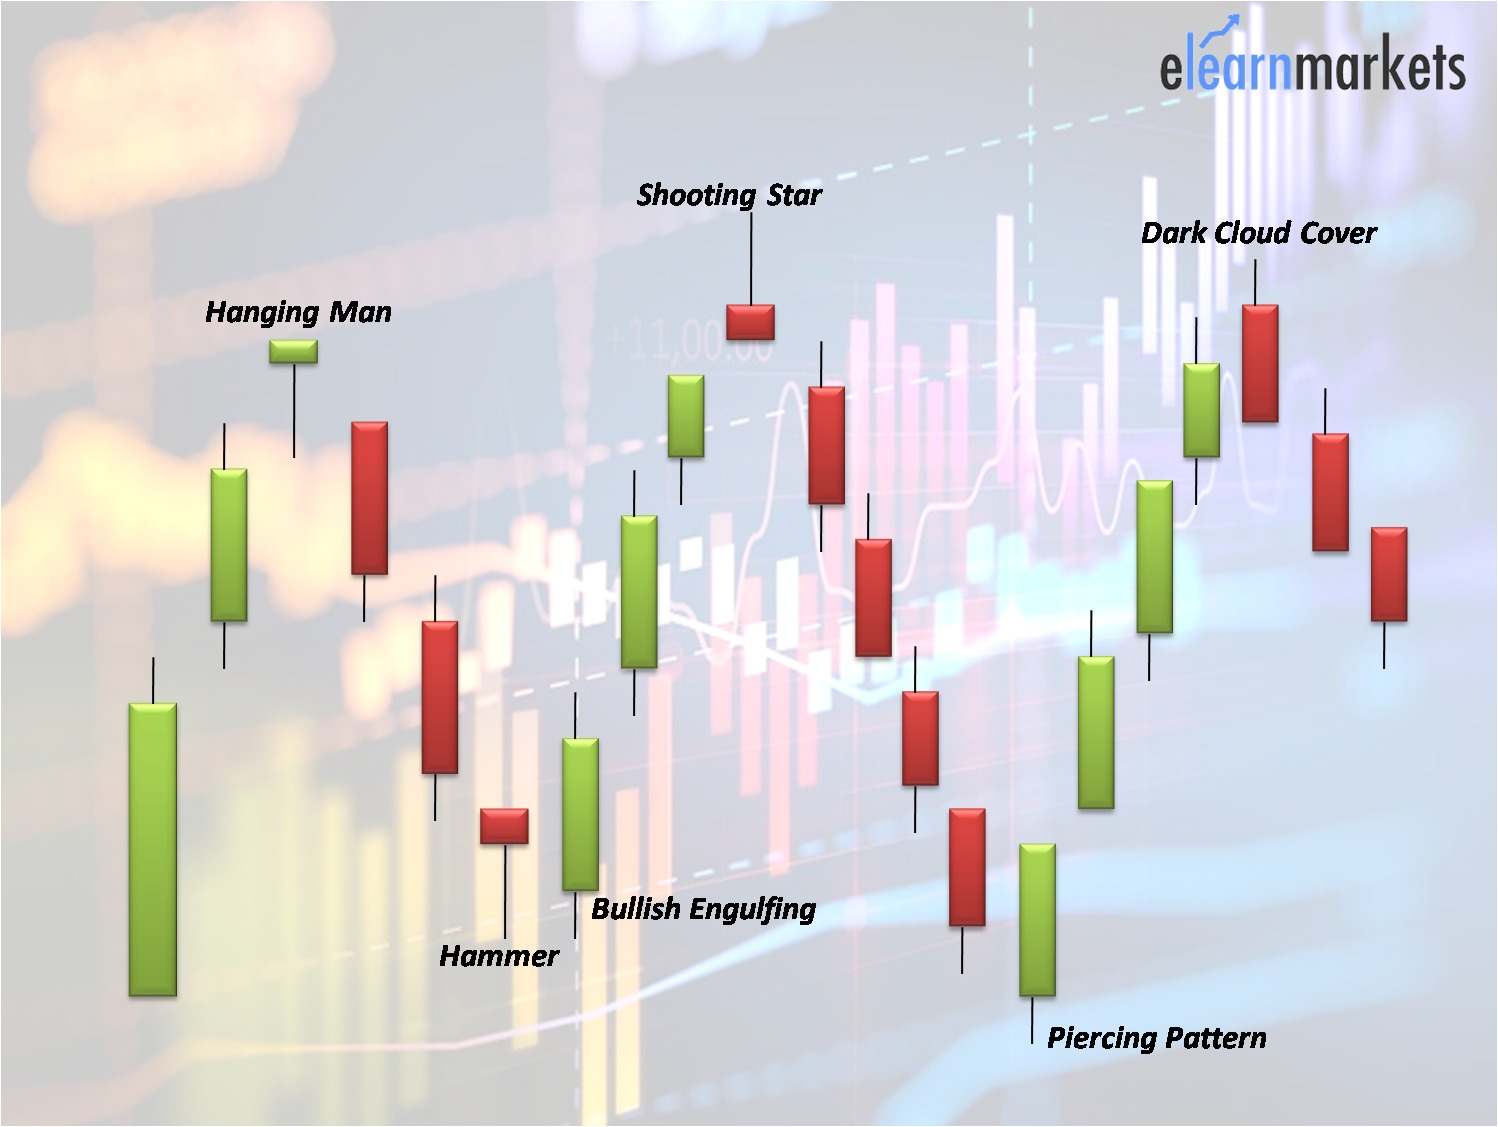
Basic Candlestick Patterns
Candlesticks are created by movements in the price.
These price movements sometimes may appear random, but at other times they form patterns which traders use for analysis or to trade.
Also Read : Basic Understanding Of Candlestick Charts
Patterns can be divided into bullish and bearish.
Bullish patterns indicate that the price may rise, while bearish patterns indicate that the price may fall.
But one should remember that no pattern works all the time, as candlestick patterns represent tendencies in price movement, but it does not guarantee. For a deeper understanding of this pattern, you can also explore our Candlestick Course for further learning opportunities.
Example of candlestick pattern:
As discussed above candlestick patterns are divided into Bullish and Bearish patterns.
Some of the Bullish Patterns are:
- The Hammer
- Bullish engulfing
- Morning star
- Piercing line
- The three white soldiers
Also Read: How to trade with Spinning Top
Some of the Bearish Patterns are:
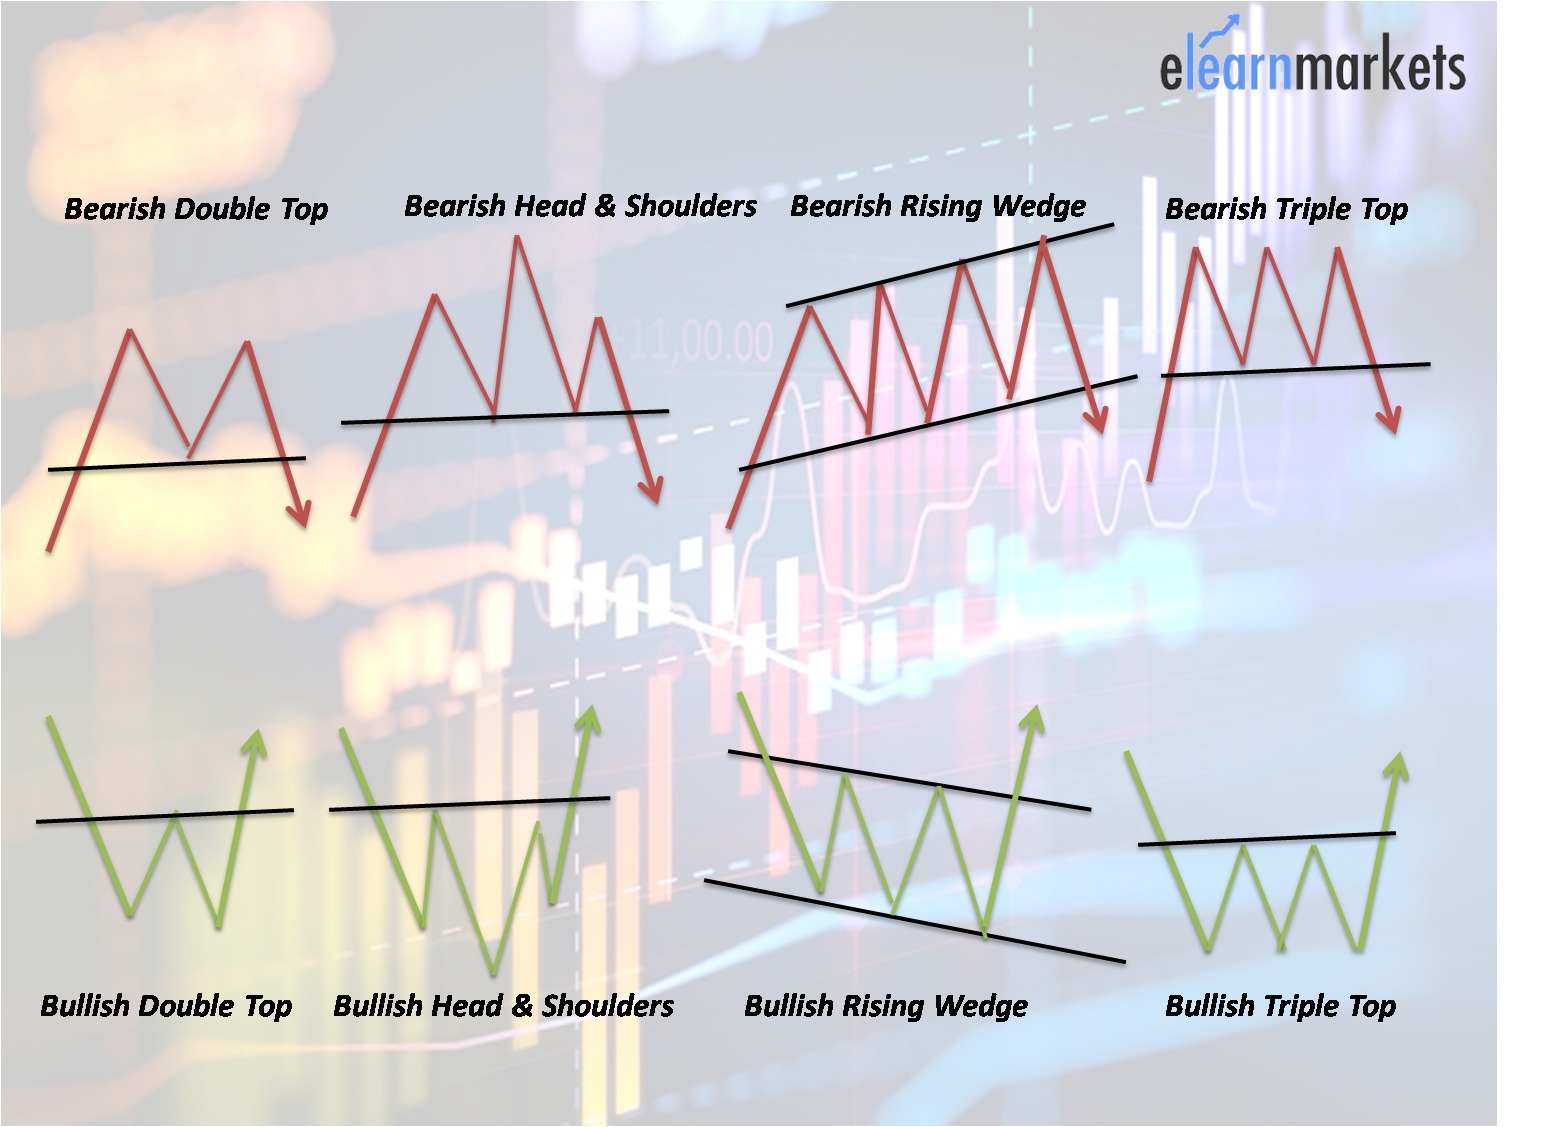
What is Chart pattern?
Chart patterns put buying and selling into perspective by consolidating the forces of supply and demand into a picture.
As a complete pictorial record of all chart patterns, trading, these chart patterns provide a framework for analyzing the previous and ongoing battle raging between bulls and bears.
More importantly, chart patterns and technical analysis also help in determining who is winning the battle, thus allowing traders and investors to position themselves accordingly.
Chart pattern analysis can also be used to make short-term or long-term forecasts.
The data can be intraday, daily, weekly or monthly and the patterns can be as short as well as long for many years.
Gaps and outside reversals may form in one trading session, whereas broadening tops and dormant bottoms may require months to form.
Example of Chart pattern:
Below are some of the examples of chart patterns:
- Double Top
- Head and shoulders
- Rising and falling wedge Triangles
- Triple top
Difference between Candlestick and chart pattern:
Let us discuss the differences between candlestick and chart patterns:
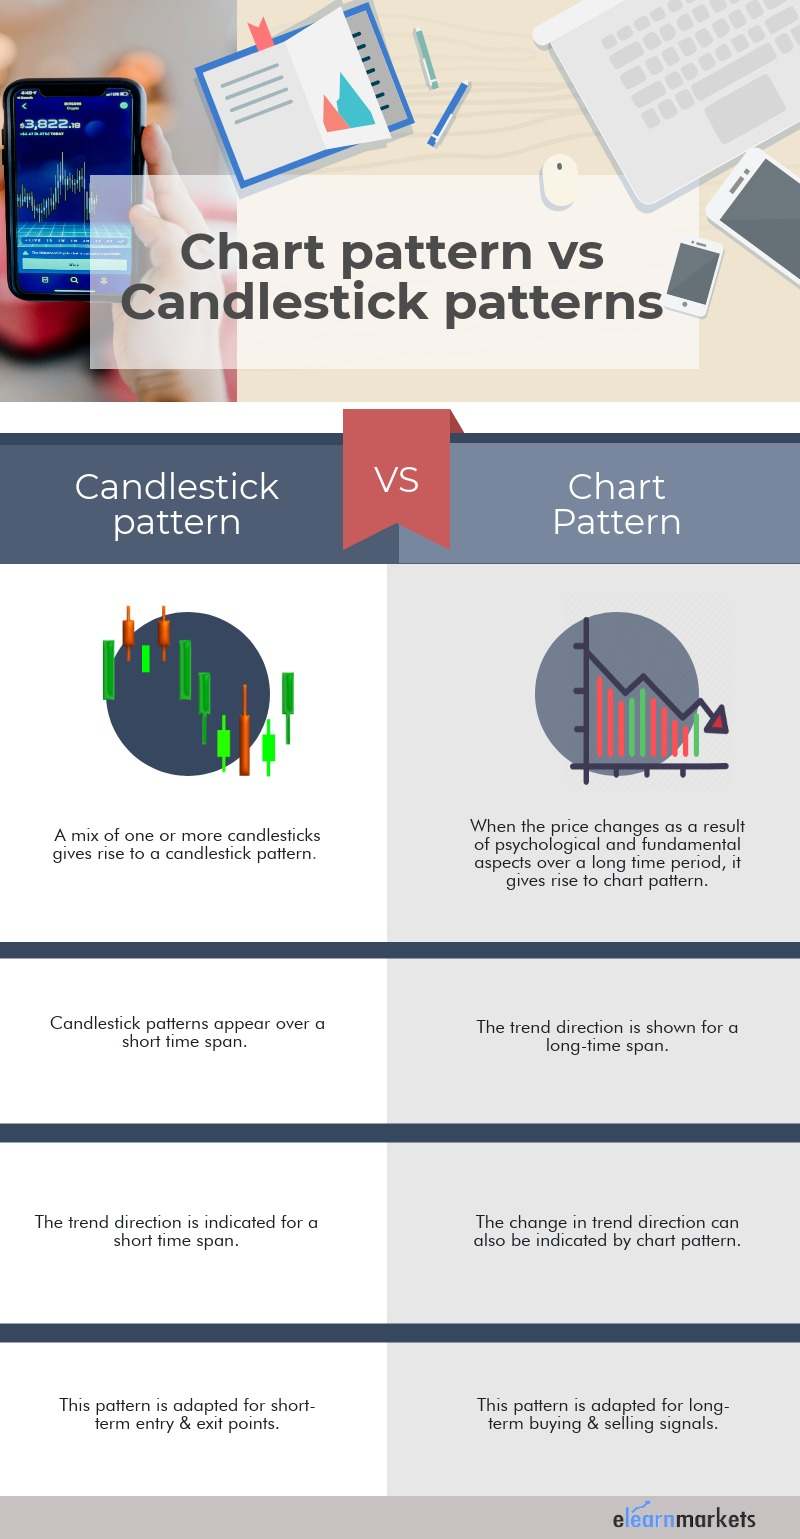
- Candlestick pattern is a mix of one or more candlesticks. On the other hand When the price changes as a result of psychological and fundamental aspects over a long time period, it gives rise to chart pattern.
- Candlestick patterns appear over a short time span whereas the trend direction is shown for a long-time span.
- The trend direction is indicated for a short time span. On the other hand The change in trend direction can also be indicated by chart pattern.
- Chart pattern is adapted for short-term entry & exit points whereas candlestick is adapted for long- term buying & selling signals.
Key Takeaways
- The candlesticks are group into recognizable patterns which investors can use for making buying and selling decisions.
- Chart patterns put buying and selling into perspective by consolidating the forces of supply and demand into a picture.
- Candlestick patterns appear over a short time span whereas the trend direction is shown for a long-time span.
In order to get the latest updates about Financial Markets visit our website https://stockedge.com/


I have asked for verification code for about 7 times but to no avail.I doubt whether you really send the code?. Can i register without code
Hi,
You can just rest register with your email id.
I am not really superb with English but I line up this real easygoing to understand.