The CCI indicator (oscillator) developed by Donald Lambert is a versatile and widely used indicator in technical analysis which helps in identifying overbought and oversold conditions and reversals and divergences.
It also helps in taking momentum based trades.
In momentum-based trading, traders mostly focus on stocks that are giving significant move in one direction on high volume.
Momentum-based traders may hold their positions on varying time frames including several minutes, few hours or even the full trading day, based on how quickly the stock moves in case of directional change.
What is the Commodity Channel Index (CCI) Indicator?
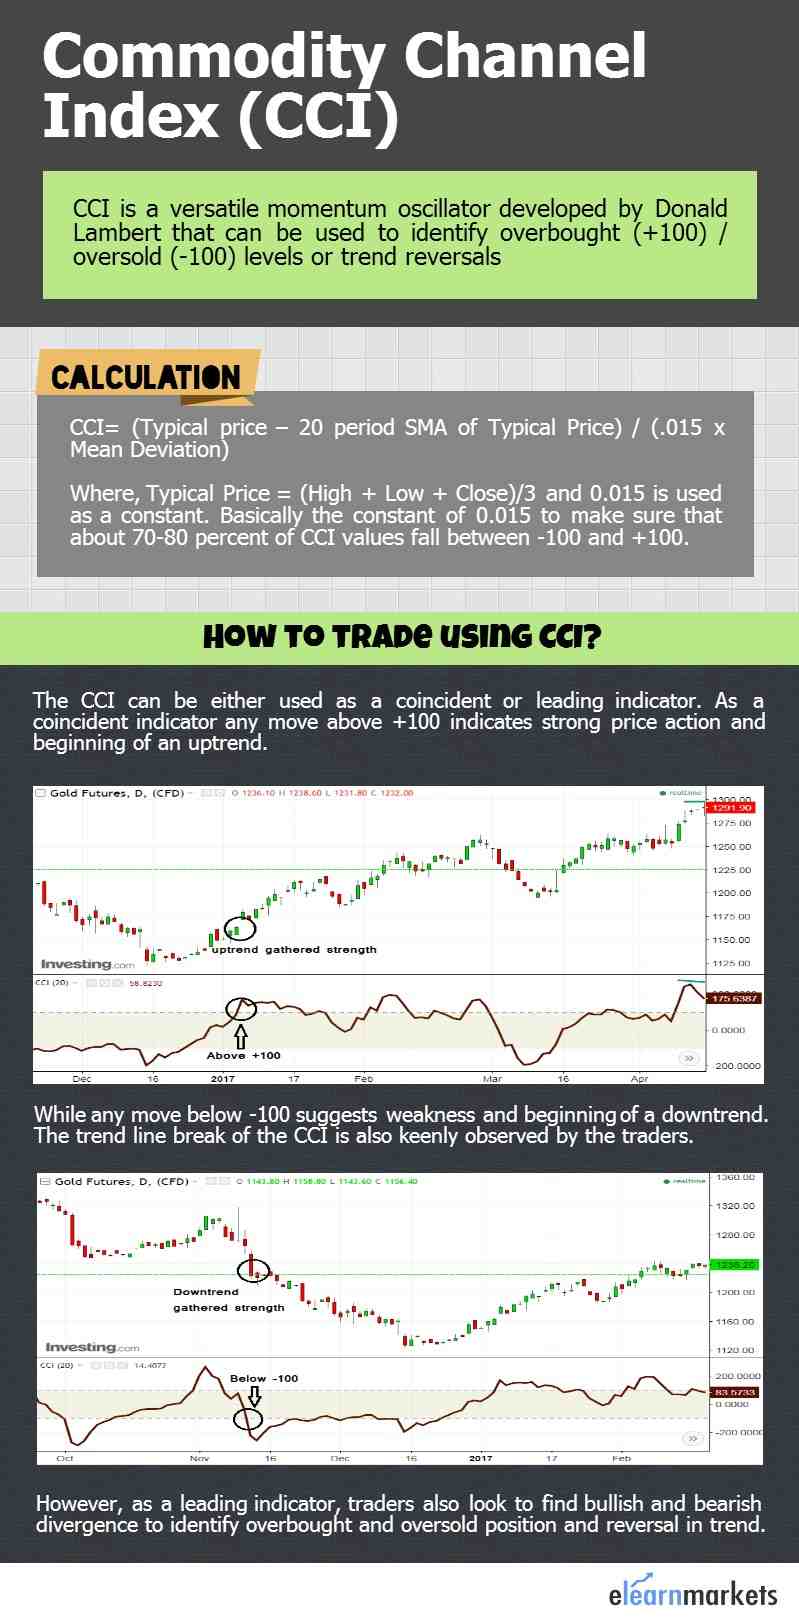
The Commodity Channel Index (CCI) indicator mainly measures the current price level relative to an average price level over a particular period of time.
CCI is high when the prices are far above their average. Similarly, CCI is low when the prices are below their average.
CCI is mainly used to identify the overbought and over sold regions.
Is CCI a leading indicator?
The CCI indicator can either be used as a leading indicator or a co-incident indicator.
As a leading indicator, one can look for the overbought or oversold zone which may indicate trend reversals. One can also look for bullish or bearish divergences for trend reversals.
As a co-incident indicator, if CCI is more than 100, then it reflects strong price action which indicates start of an uptrend. Similarly, if CCI is below -100, then it reflects week price action which indicates start of a downtrend.
What is CCI Indicator buy signal?
One should that CCI mainly moves between the range of -100 and 100.
One should enter the stock when this indicator cross 100, as it which indicates a buy signal and exit the stock when this indicator cross -100, as it which indicates a sell signal.
Also Read: 5, 30 Moving Average crossover strategy using ROC
CCI Indicator Strategy
How does CCI indicator work?
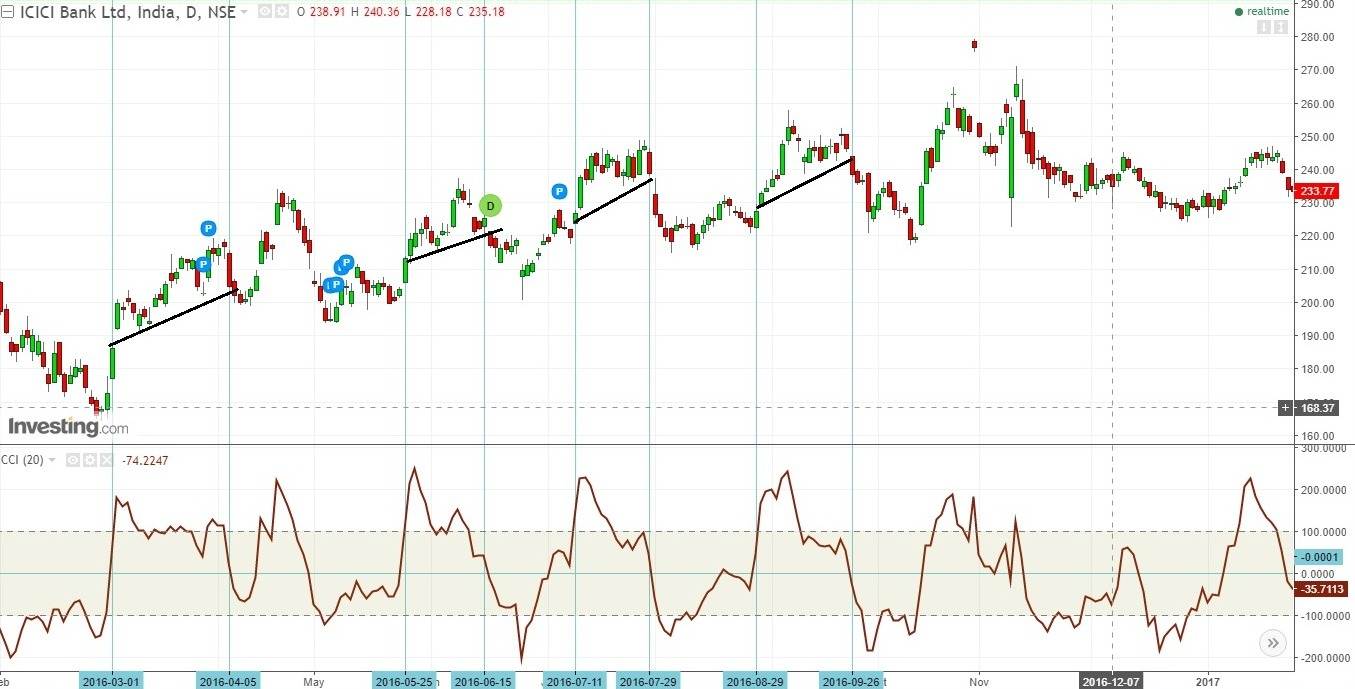
In a strongly up trending market, a Commodity Channel Index move above 100 is considered to be an entry point for a momentum trader from bullish side.
Once entered, his exit will be triggered when CCI moves below 0 level.
Know More: How to trade using Larry Connor’s 2-period RSI?
In the following daily chart of ICICI bank, we see many such examples where this strategy could generate a substantial profit.
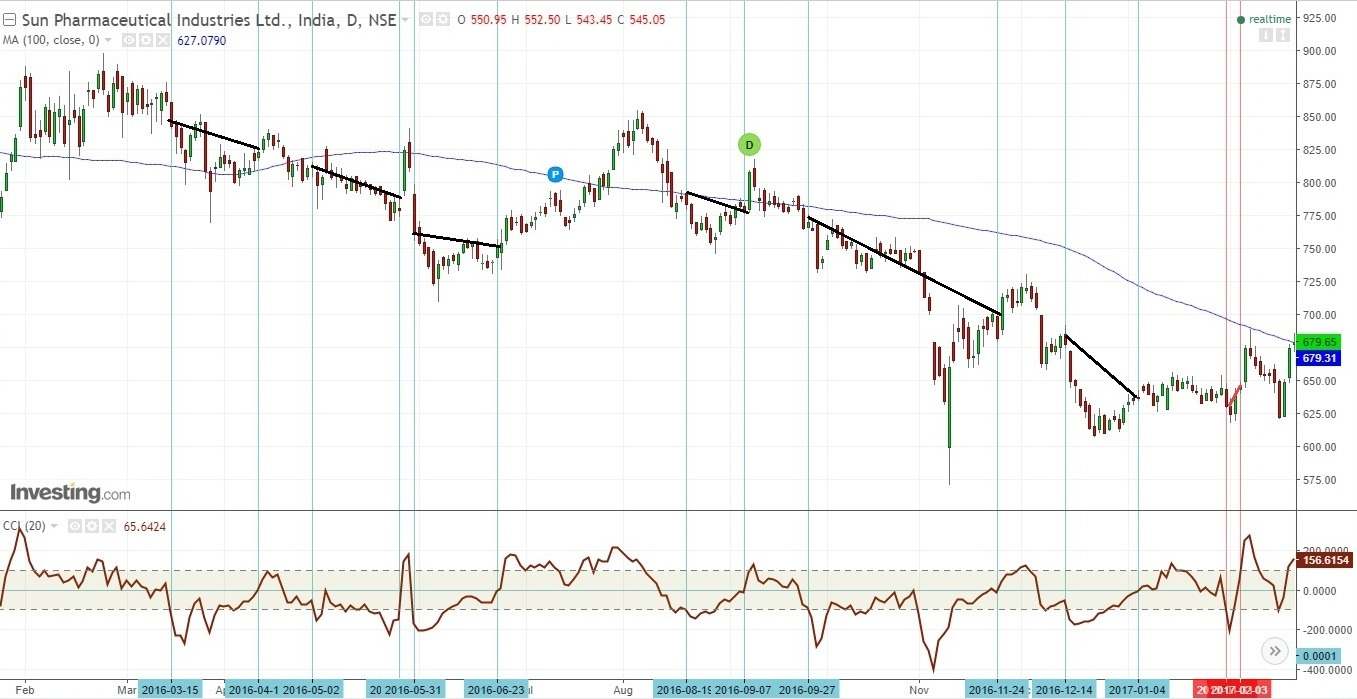
Similarly, in a down-trending market, Commodity Channel Index moving below -100 is considered as a sell signal and the exit for this short position is triggered by a move back of CCI above 0 level.
The following daily chart of Sun Pharma shows many such short (someone could primarily look at short trades as we could see the trend was broadly down, indicated by the downward slope of the 100 dma) trades with only one of them failing (indicated in red) during the time frame under consideration.
CCI Indicator vs RSI
The Relative Strength Index (RSI) and Commodity Channel Index (CCI) are both popular technical indicators.
The differences between them are as follow:
- The RSI tracks the momentum of price changes to analyse the overbought and oversold conditions, whereas the CCI focuses on normal deviations from an asset’s moving average price in order to spot divergences.
- The RSI compares the relationship between the average of up-closes and the average of down-closes over a particular time period, usually 14 days. The readings of RSI oscillate between zero and 100, with a midpoint of 50, and considering overbought above 70 and oversold below 30 levels.Unlike the RSI, the CCI does not have particular range bounds, which can make it more difficult to read.
Does CCI indicator repaint?
A repainting indicator is a technical indicator which constantly repaints its values, which means it keeps changing the signals in real time.
CCI is a non-repainting indicator as it does not repaint its values once the price bar is closed.
Bottomline
The very fact that CCI has been used by the traders so long signals its importance in the trader’s community.
However, unlike other oscillators, one should use CCI in conjunction with price or other indicators rather than looking on a standalone basis.
Here we have seen just one use of CCI but we can use CCI in many other ways to plan and execute our trade.
We can get better and more confirmed trades by combining it with price data and other relevant indicators.
You can do NSE Academy Certified Technical Analysis course to learn Technical Analysis from the very scratch and also to upgrade your skills in order to get better trades.
In order to get the latest updates on Financial Markets visit https://stockedge.com/


