Investing in Life insurance companies may appear risky as these businesses consist of long-term products and services, and also require high initial acquisition costs.
Therefore, a financial statement that provides the current year’s realized income, with the entire acquisition cost charged upfront, provides an incomplete picture of value creation and profitability is what one should look at on investing in these companies.
So, we will discuss some key financial parameters that you can use to analyze Life Insurance (LIC) companies before investing in them.
| Table of Contents |
|---|
| Embedded Value(EV) |
| Value of new business(VNB) |
| Value of new business (VNB) margin |
| Persistency Ratio |
| Solvency Ratio |
| Key Takeaways |
1. Embedded Value (EV)
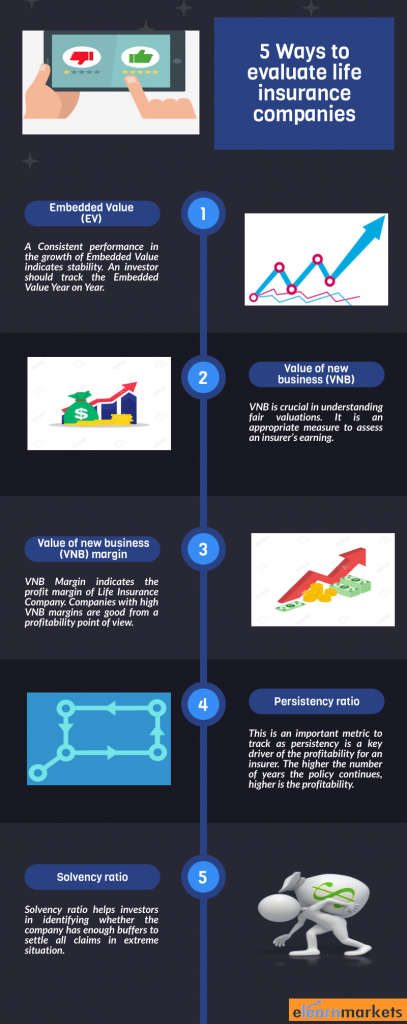
Embedded Value is a measure of the value of the Life insurance Company. This is an important metric, which reflects the expected profitability from the current underwritten policies plus current net worth.
EV is computed as the sum of the adjusted net worth (ANW) and the discounted value of profits from in-force policies (VIF).
Consistent performance in the growth of Embedded Value indicates stability.
Companies that experience huge dips or spikes are required to be tracked closely as any change in product strategy, distribution model, expense performance, persistency gets reflected in the EV. An investor should track the EV Year on year.
2. Value of new business (VNB)
Value of new business is used to measure the profitability of the new business written in a period. It is the present value of all future profits to shareholders measured at the time of writing the new business contract.
VNB is crucial in understanding fair valuations. It is an appropriate measure to assess an insurer’s earning.

3. Value of new business (VNB) margin
VNB margin is the most important metric that a shareholder must track.
VNB margin indicates the profit margin of Life Insurance Company.
VBN margin is calculated by dividing the Value of New Business by Annualized Premium Equivalent (Regular Premium +10% of Single Premium).
Forex:- A VBN margin of 20% would mean that if the insurer underwrote a new business premium for a particular mix of products of Rs. 100 in a year, the expected profit over the lifetime of that business is Rs.20.
Companies with high VNB margins are good from a profitability point of view.
Insurers derive higher VNB margins from their protection business. If a company wants to improve its margins, they have to focus more on the protection business.
4. Persistency Ratio
Persistency ratio measures how long customer persists with their policies. This is an important metric to track as persistency is a key driver of the profitability for an insurer.
The global average of 13th-month persistency (a policy that renews after a year) is close to 90% whereas the 61st-month persistency (a policy that renews after 5 years) is about 65%.
For example:- If the 61ST-month Persistency ratio of a company is 50%, it means half of the company customers are not paying a premium after five years.
Persistency is an important metric to consider while evaluating stocks of a life insurance company and should compare with global benchmarks. The higher the number of years the policy continues, higher is the profitability.
5. Solvency Ratio
The solvency ratio defines how good or bad an insurance company’s financial situation is on defined solvency norms.
According to Insurance Regulatory and Development Authority of India (IRDAI) guidelines, all companies are required to maintain a solvency ratio of 150% to minimize bankruptcy risk.
The solvency ratio is calculated as the amount of Available solvency margin (AMS) in relation to the amount of Required Solvency Margin (RSM).
(The ASM is the value of the company’s assets over liabilities, and RSM is based on net premiums and defined as per IRDAI guidelines.)
The solvency ratio helps investors in identifying whether the company has enough buffers to settle all claims in an extreme situations. It is a good indicator of an insurance company’s financial capacity to meet both its short-term and long-term liabilities.
All these metrics mentioned above are important factors in evaluating the fundamentals of a life insurance company.
Key Takeaways
These metrics should be compared with life insurance company’s peers to decide whether one should invest in that particular stock or not.
Insurance penetration in India continues to be low, which means there is greater scope for multi-year growth.
Digitization and its fastest implementation will help the life insurance companies to grow their business.
An investor should also include some of the softer parameters such as the brand image, which to determines the valuations.


Effective
Hi Palak,
Thank you for reading!
Keep Reading!
Very helpful, was reading a research report on a life Insurance company, and exactly these metrics were highlighted there.
Hi,
Thank you for Reading!
Keep Reading!
Thanks for writing such a usefull points for insurer professional
Hi,
Thank you for Reading!
Keep Reading!