Hindi: आप इस लेख को हिंदी में भी पढ़ सकते है|
Determining support and resistance is quite a common problem faced by most traders. Some of the common methods to determine support and resistance include trend lines, moving averages, super trend, Fibonacci retracement etc. Today, you will learn how to determine probable support and resistance levels using Fibonacci Extension
| Table of Contents |
|---|
| Fibonacci Series |
| Fibonacci Extension |
| Fibonacci Extension Examples |
| Bottomline |
What is Fibonacci Series
Fibonacci series incorporates a series of analysis tools on the basis of Fibonacci ratios and sequence showing geometrical law of human behavior and nature which is also applied to financial markets.
The Fibonacci study can be applied to identify probable support and resistance levels by studying Fibonacci numbers in various timeframes.
Fibonacci series is a series of numbers beginning from 0 and arranged in such a manner that any particular number of the series is simply the summation of the previous two numbers which is shown below-
0, 1, 1, 2, 3, 5, 8, 13, 21, 34, 55, 89, 144, 233, 377 and so on.
Lets understand the above logic with an example-
377 = 233 + 144
233 = 144 + 89
144 = 89 + 55
89 = 55 +34 55 = 34 + 21
34 = 21 + 13
And it goes on
An interesting property of this Fibonacci series is that if you simply divide any number in the series by the previous number, the ratio always comes to 1.618; which is considered as the Golden Ratio also referred to as ‘Phi’.
Let’s have a closer look at this-
377/233 = 1.618
233/144 = 1.618
144/89 = 1.618
89/55 = 1.618
55/34 = 1.618
34/21 = 1.618
And so on.
Let’s look at some other properties of this ratio and you will find a unique consistency when a particular number in the Fibonacci series is divided by a number two place prior to the given number. For instance:
377/144 = 2.618
233/89 = 2.618
144/55 = 2.618
89/34 = 2.618
55/21 = 2.618
And it goes on
Similar consistency can be seen when any number in the Fibonacci series is divided by a number three prior to the given number. For example:
377/89 = 4.236
233/55 = 4.236
144/34 = 4.236
89/21 = 4.236
55/13 = 4.236
What is Fibonacci Extension?
Fibonacci Extension is drawn by joining three points, unlike Fibonacci Retracement which has just two points by joining the lowest and the highest points of a pre-defined trend and vice versa.
Let’s understand how we can draw Fibonacci Extension in case of an uptrend. You need to join the lowest and the highest point and then after a retracement or a correction, the price continues in the direction of the original trend, the low of the retracement or a pullback would be our third point.
For example, suppose a stock moved from Rs 100 to Rs 200 and say after a retracement till 160, the stock moves in the direction of the original trend. So the first point to draw Fibonacci extension would be 100, the second point will be 200 and the third point will be 160. This will give you probable resistance where the stock may face resistance in the near future.
The most common Fibonacci extension levels are 161.8%, 261.8% and 423.6%. Though the ratio may be a little distorted at the beginning of the sequence as the number gets bigger, the above-proved ratio appears. Though these are quite far-off numbers, so the other important resistance levels using Fibonacci extension come at 50%, 61.8%, 78.6%, and 100%, the derivation of these numbers is discussed in last week’s article on the Fibonacci retracement.
When the stock is trading at a lifetime high area where there is no prior resistance, you may draw probable resistance levels using the Fibonacci extension.
Fibonacci Extension Examples:
Let’s look at some of the practical examples to gain more clarity about the concept of Fibonacci extension.
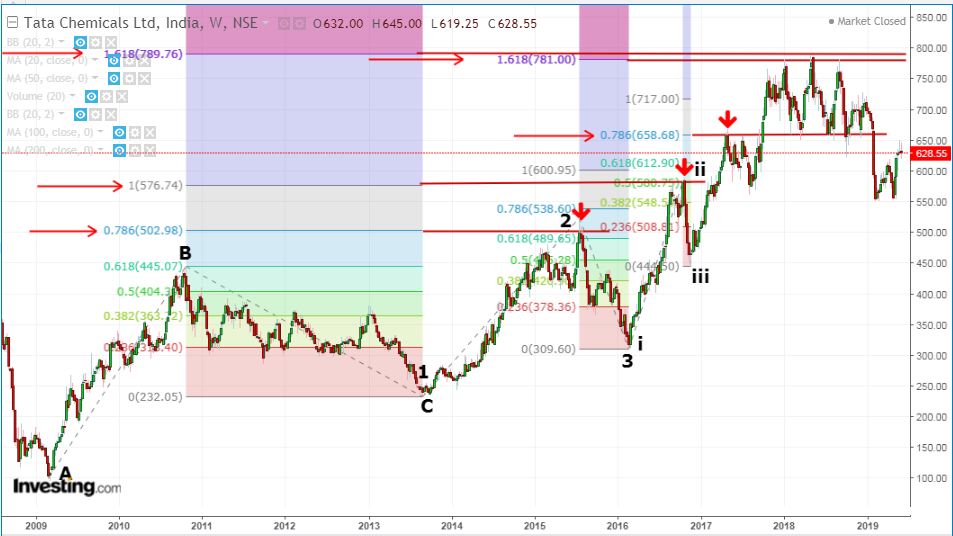
The above chart is an example of Tata Chemicals in the weekly chart and a total of three Fibonacci extensions have been drawn in the above chart to show the number of resistance identified using the above logic. Let’s look at the Fibonacci extensions one by one.
In the case of Fibonacci extension ABC, the stock faced resistance from 78.6% extension (503) on 20th July 2015 and witnessed a sharp selloff after it failed to close below 500 level and made a low of 309.6.
The next 100% extension of ABC acted as strong resistance at around 580 levels on 17th July 2016 and cracked about 23% from the highs.
Now in the case of Fibonacci extension (i ii iii), the rally which started in the month of November 2016; the stock faced resistance from 78.6% extension (660) and corrected about 100 points from the highs.
The recent correction which started from the beginning of the year 2018 and continued more than a year’s time, faced resistance right at the convergence of 161.8% extension of both ABC and 123 Fibonacci extensions and cracked about 30% from the highs.
A slight touch of Fibonacci retracement will be a revision of the article discussed a few weeks ago. The correction which started in 2018 got reversed right 50% Fibonacci retracement after making a double bottom almost at 550.
Here are some other examples of Fibonacci extension in recent days.
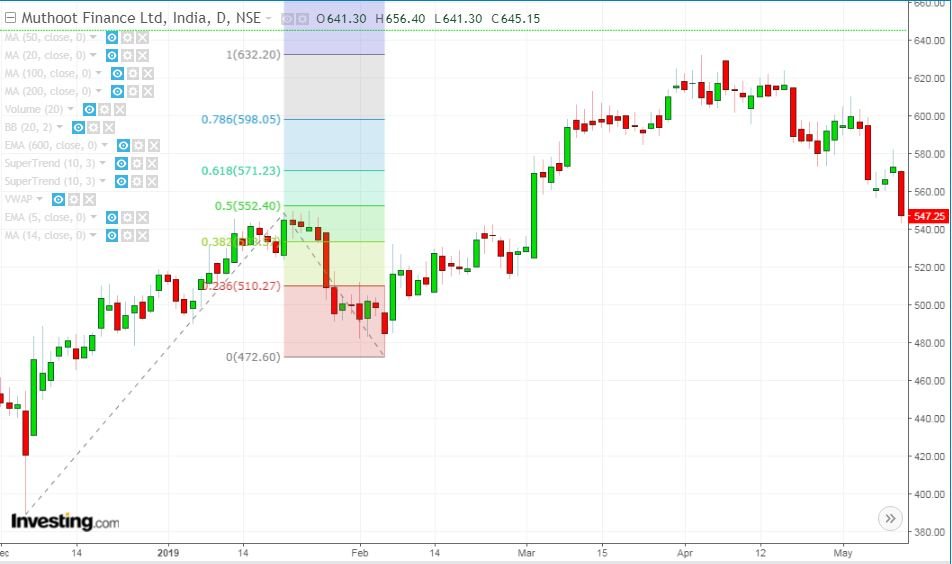
The below is an example of Muthoot Finance and as you can see in the chart, the stock faced slight resistance from 61.8% and 78.6% retracement and finally faced strong resistance from 100% extension at 632 level in the first week of April 2019 and cracked almost 14% from the highs.
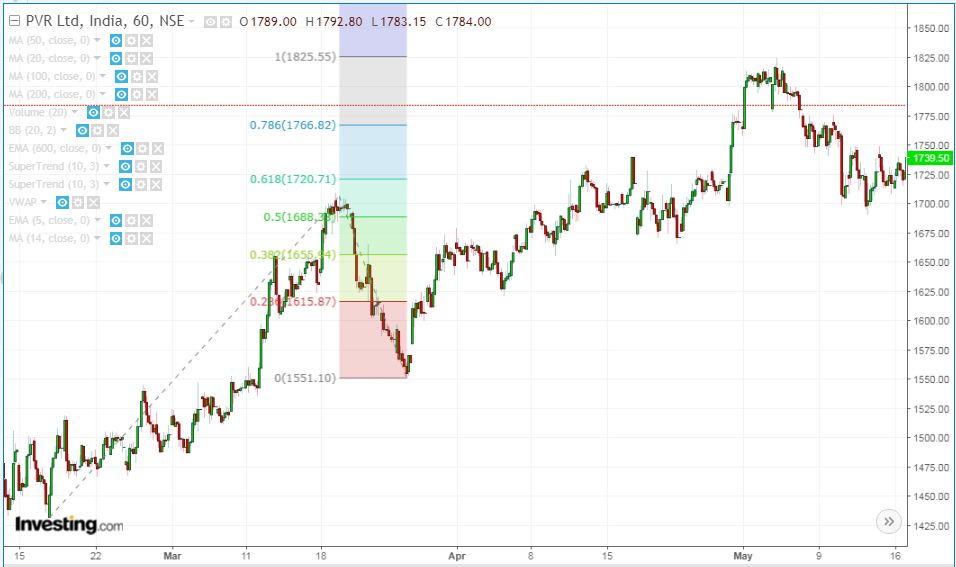
The below is an example of PVR ltd and as you can see in the hourly chart that the stock faced resistance from100% Fibonacci extension in the first week of May 2019 and cracked more than 7% from the high.
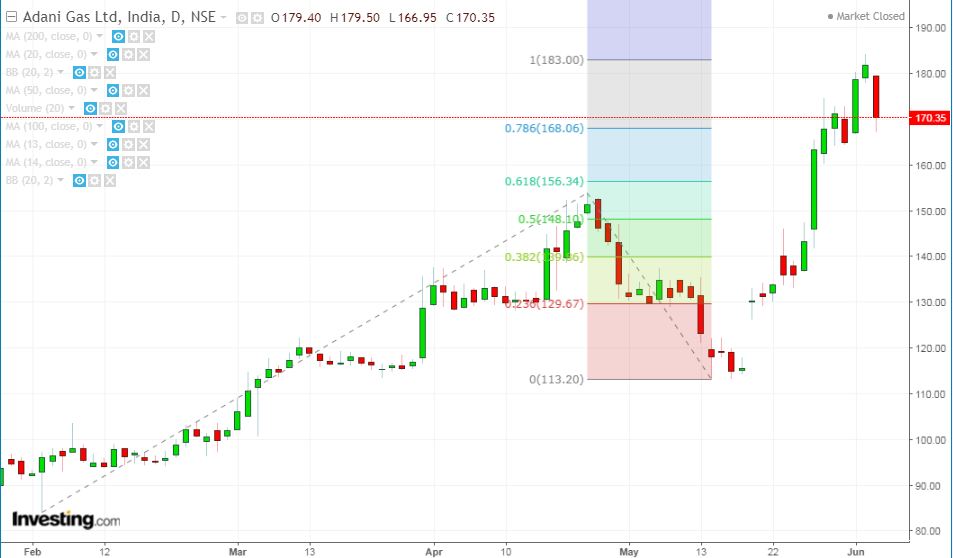
The next example is of Adani Gas which recently faced resistance from 100% extension and just started to witness correction. The further move will be unfolded in the coming period.
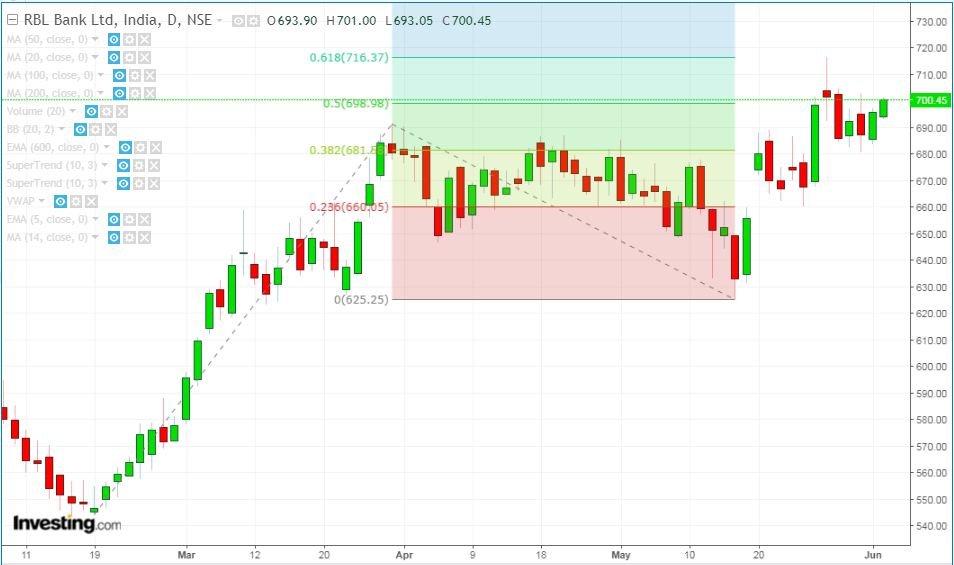
The next one is a daily chart of RBL bank and as you can see in the below chart that the stock faced resistance from 61.8% Fibonacci extension and cracked more than 7.5% in such a short span.
Bottomline
Though Fibonacci is one of the useful methods to analyze your chart it doesn’t provide an exact entry point rather an estimated area of entry. Moreover, there is no guarantee that the price will reverse from any specified Fibonacci extension level and hence you should combine it with other technical parameters as a confirmation.


