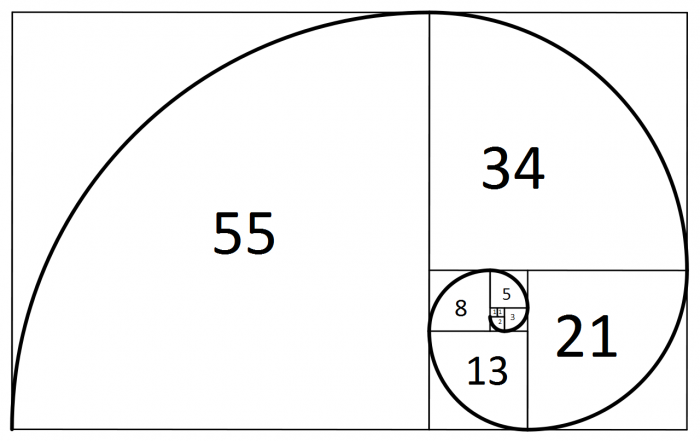
Technical analysis is a vast and diverse field of analysis. It has many tools that make it a successful method to analyze stock markets. The Fibonacci series is one such tool which has stood its test of time. It is a popular tool based on key numbers and their sequence.It was identified by mathematician Leonardo Fibonacci. Leonardo de Pisa, also known as Fibonacci to his friends, was a 12th – century monk.He discovered a fascinating numeric sequence which is found in mathematics as well as various other phenomena- in nature. While studying the Great Pyramid of Gizeh, Leonardo discovered a unique ratio of numbers. The series of numbers 1, 1, 2, 3, 5, 8, 13, 21, 34, 55, 89, 144, 233, 377, 610 etc. created by adding the first two numbers together and that process continuing in sequence.
In this case, we can take an example from the following sequence: 1+1=2, 1+2=3, 2+3=5, 3+5=8, 5+8=13 etc. An interesting ratio is produced from this sequence. If each number is divided by the number following the sequence, it produces a remarkably constant ratio. The ratio value is 0.6180345. It has been referred to as the “Golden Ratio”. These ratios have been found in many studies whether in mathematics or in nature’s natural series of events. A large majority of patterns in the leaves or petals of flowers and also a formation of storms happen in the sequence of the Fibonacci numbers.| Table of Contents |
|---|
| Fibonacci Retracements |
| Where can a pullback expect to stop? |
The common Fibonacci numbers are 38.2%, 50%, and 61.8%. The repetitious results that have become apparent through centuries of investment habits indicate that these numbers are significant when applied to human emotions. These numbers have become important pivotal points when analyzing retracement of a trend. The Fibonacci numbers are the crucial numbers for the Elliott wave analysis. They play a major role in analyzing the way you think and how your emotions play a role in your investment decisions. Realizing that many technical investors use these critical levels to anticipate reversals, it makes sense to utilize these potential reversal levels when applying candlestick signals
Fibonacci Retracements:
Fibonacci Retracements are based on a trendline drawn between a trough and peak. If a trend is rising, the retracement lines will descend from 100% to 0%. If a trend is declining, the retracement lines will move up from 0% to 100%. Horizontal lines can be drawn at the common Fibonacci levels of 38%, 50%, and 62%. As the price retraces, support and resistance occur at or near the Fibonacci Retracements levels with a high degree of accuracy.
If the 38%, 50%, and 62% area are known to be retracement levels that many technical investors are watching, then it makes sense to analyze what candlestick signals might be occurring at any one of those levels.
The advantage of being able to read the candlestick formations is very beneficial. It allows an investor to evaluate immediately which one of these levels is going to act as support or resistance. The knowledge allows you to position yourself ahead of other technical analysts who need confirmation that a certain level has been held.
For the day-trader, utilizing this knowledge can be highly profitable when trading the index futures. Being able to enter a trade at the optimum level provides a very high-profit, low-risk trading platform. You can utilize the Fibonacci levels as a primary trade entry system or it can be added as an additional entry parameter.
If a trend pattern can be recognized, then watching for the candlestick signals at support levels that other investors are watching can prepare the investor for when a reversal should occur.
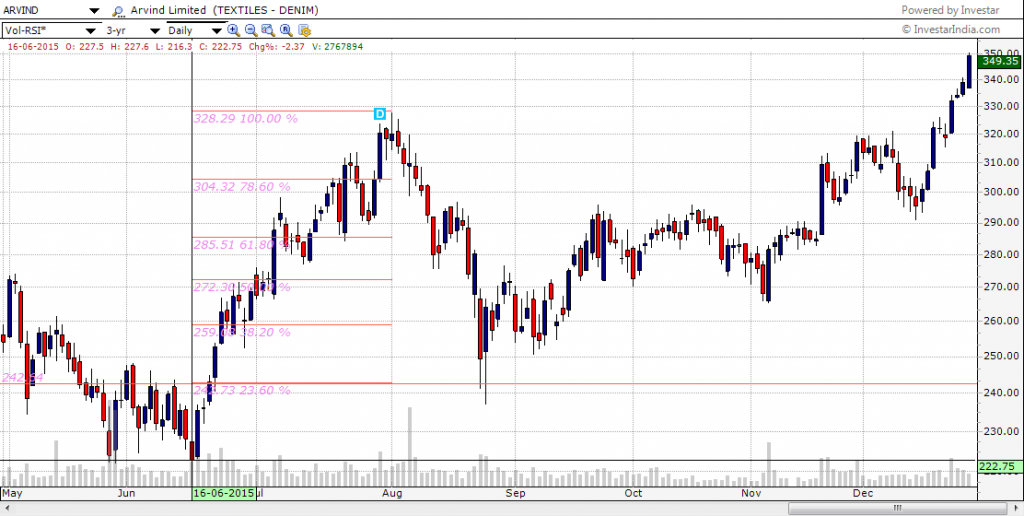
As seen in the chart given above, Arvind Ltd. had a strong uptrend which was followed by a pullback. To identify where the pullback should stop, applying the obvious technical indicators increases the probabilities of being in a correct trade. The chart illustrates the effective use of candlestick signals with the Fibonacci numbers. After an extended uptrend from 222 to 330, a pullback occurs.
Where can a pullback expect to stop?
Putting Fibonacci numbers on the chart becomes a logical target. After the chart doesn’t hold the important reversal levels of 61.8%, 50%, 38.2%, a reversal is finally seen at the 23.6% level i.e. at 259. Is the 23.6% Fibonacci retracement level always placing to watch for a reversal? Not necessarily!
Also Read: All you need to know about the Japanese Candlestick
The candlestick reversal signals are the primary decision-making factors. Placing the Fibonacci retracement levels on the candlestick chart adds another element for indicating that a reversal has occurred.
To know more about Fibonacci Analysis you can watch the video below:
Hence the Fibonacci series and the Fibonacci Retracement is a tool of technical analysis which adds to the certainty of the downtrend having a reversal. Confirming the reversal and taking a trade against the trend is a decision which should be taken with a pinch of salt.


Greetings from Los angeles! I’m bored to tears at work so I decided to browse your blog on my iphone during lunch break. I love the info you present here and can’t wait to take a look when I get home. I’m surprised at how quick your blog loaded on my cell phone .. I’m not even using WIFI, just 3G .. Anyways, good site!
Keep functioning ,splendid job!