Technical analysis is a method of analysis of financial instruments with the use of price data and statistical tools.
It tries to determine the future trend and movement of the price with the help past market data.
Just like fundamental analysts, technical analysts also have different styles of analysis.
Read More: Technical vs Fundamental Analysis
Some prefer chart patterns while others prefer technical indicators.
Some people prefer both of them and use them efficiently.
Candlestick charts are also a part of the modern-day technical analysis.
The effect of the candlestick can be very short-term in nature.
A single candlestick can consist of the price data of a time period as short as an hour, 30 minutes, 15 minutes to as little as 1 minute
But it can also be as long as a day, a week or even a month.
So, the massive growth of intraday and swing traders in today’s trading generation has been made possible with the help candlestick charting.
Learn more about Japanese Candlesticks in NSE Academy Certified Technical Analysis course on Elearnmarkets.
Japanese candlestick charts are probably the oldest type of charting technique used for price prediction.
Dating back to the 1700s, the earliest forms of candlestick charts were originally used to predict rice prices.
In 1750, a wealthy Japanese merchant by the name of Munehisa Homma started using his own personal candlestick analysis to trade at the Rice exchange at Sakata.
Homma became a legendary rice trader and amassed a great fortune.
It is said that he executed over 100 successive winning trades.
You can read about different candlestick patterns in our free e-book.
Candlestick shapes and formations were given descriptive names by the Japanese Traders, partially due to the military environment of the Japanese during the era when the candlestick charting was first used.
Many of the pattern formations names like ‘Three advancing white soldiers’ or ‘counterattack lines’ are derived from terms of the military.
You can also read: Japanese Candlestick Pattern: MARUBOZU
You can watch the video below to know more about Japanese Candlestick by watching the video below:
Coming back to present times, in order to plot candlesticks correctly, it requires the open, high, low, and close of a period of time be it a 10-minute session or one hour, daily, weekly or monthly.
Initially, it may seem that they do not provide any additional information with regard to technical analysis or western bar charts.
But, they display the same information in a more graphic way which makes it possible to spot certain price patterns and characteristics that are associated with changes in trend.
Even though candlestick charts appear more visually appealing than the standard bar chart, they preset the same information as that of bar charts.
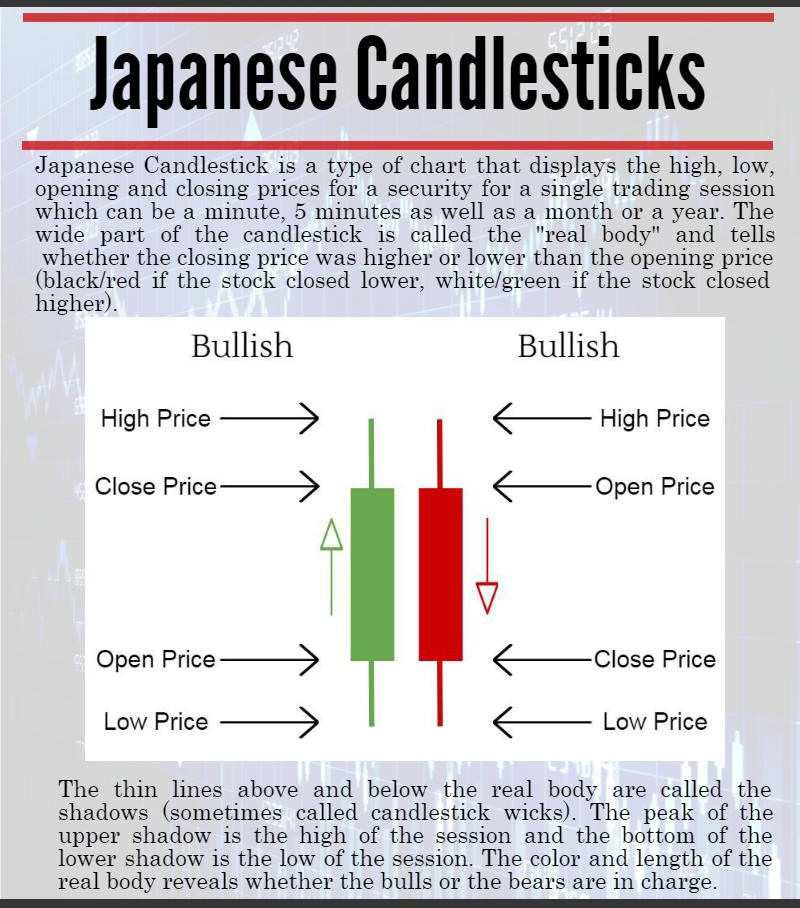
Each candle contains four common elements for construction. they are the open, high, low and closing price for a given period.
It is the way that candlesticks are explained that makes them unique and give them special interpretive powers.
The rectangle portion of the candle, called the real body, represents the range of opening and closing price as we can see in the diagram.
The top of the candle represents the higher of the two prices, the low of the candle presents the lower price.
So how can we tell which is the opening price and which is the closing price?
The answer lies in the color of the rectangle.
If the rectangle is white or green (can be blue as well), the lower part of the rectangle represents the opening price and the top part represents the closing price (usually a bullish period).
Alternately, if the rectangle is black or filled-in, the opening price is at the top and the closing price at the bottom (usually a bearish period.)
But what about the high and low for the day?
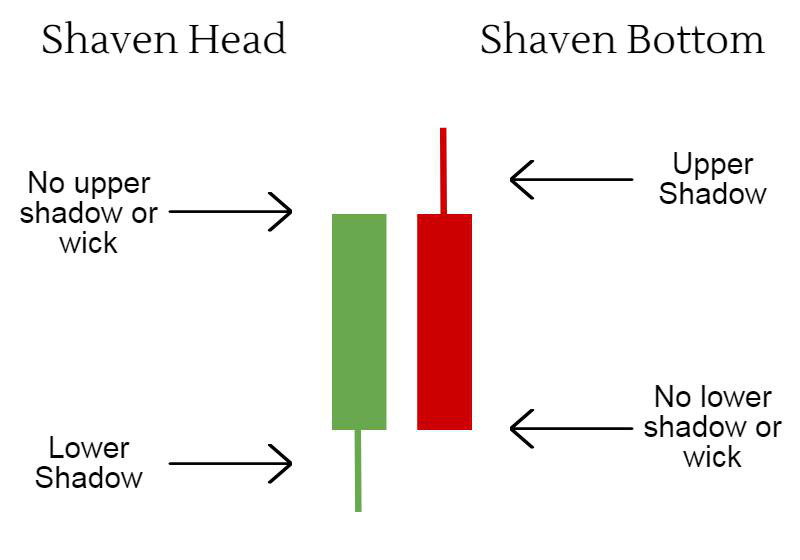
The thin lines that appear above and below the real body are known as shadows.
The line above the real body is the upper shadow and the one that appears below is called the lower shadow.
A candle having no upper shadow is said to have a shaven head, whereas one with no lower shadow is called a shaven bottom.
Although the Japanese view the real body as the decisive price movement, shadows are mostly thought of as superfluous price fluctuations.
You can also learn in detail with our Candlestick Course Online.
Bottomline:
We hope that the above write up has helped you to gain an understanding of Japanese Candlestick.
Feel free to give your feedback by using the comment box below.
Happy Learning!!


Good work!
Hi,
Thank you for Reading!
Keep reading!
I think you have observed some very interesting points, thanks for the post.