Elearnmarkets - Financial Market Learning
  • Categories
    • Basic Finance
    • Derivatives
    • Financial Planning
    • Fundamental Analysis
    • Technical Analysis
    • Marketshala
    • Miscellaneous
  • Language
    • English
    • Hindi
    • Bengali
No Result
View All Result
  • Courses
  • Webinars
  • Go To Site
  • Login
Elearnmarkets
  • Categories
    • Basic Finance
    • Derivatives
    • Financial Planning
    • Fundamental Analysis
    • Technical Analysis
    • Marketshala
    • Miscellaneous
  • Language
    • English
    • Hindi
    • Bengali
No Result
View All Result
Webinars
Elearnmarkets - Learn Stock Market, trading, investing for Free
No Result
View All Result
Home Technical Analysis Market Analysis Charts
KSCL

KSCL

Kaveri Seed sprouting in the bounds of a Symmetrical Triangle

Elearnmarkets by Elearnmarkets
November 18, 2020
in Charts, Market Analysis
Reading Time: 2 mins read
0
273
VIEWS
Share on FacebookShare on TwitterShare on WhatsApp

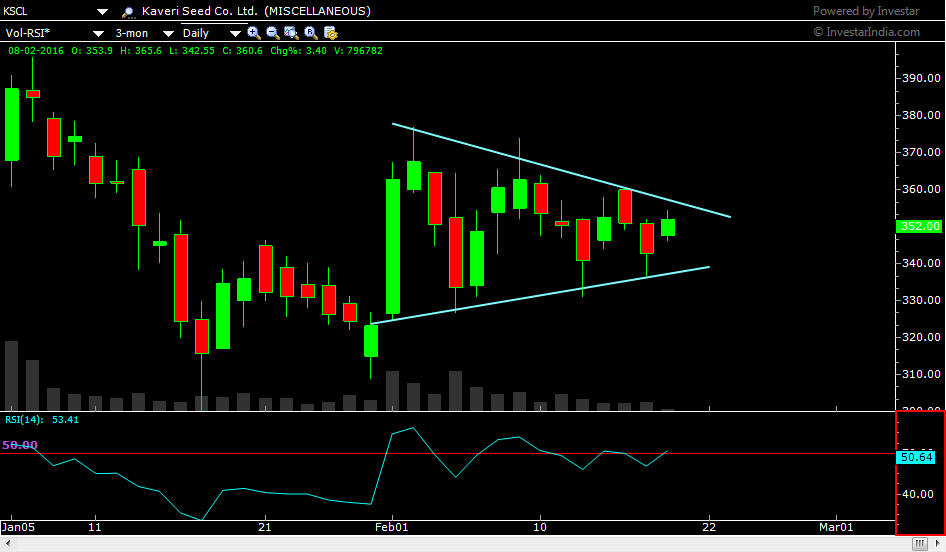
A symmetrical triangle is a technical chart pattern which is formed in bounds of two converging lines.

It shoots high or low, depending on the direction of the breakout.

If we look at the chart of Kaveri Seed Company Limites (KSCL) we will see that a symmetrical triangle is currently under formation on its charts and is probably very close to a breakout.

KSCL forms Symmetrical Triangle at 52 weeks low level
CHART#1: KSCL forms Symmetrical Triangle at 52 weeks low level

Know More: Symmetrical Triangle / Coil pattern / Isosceles Triangle

In the recent slide witnessed all over the stock market, we saw most stocks decline.

Kaveri seed was no exception.

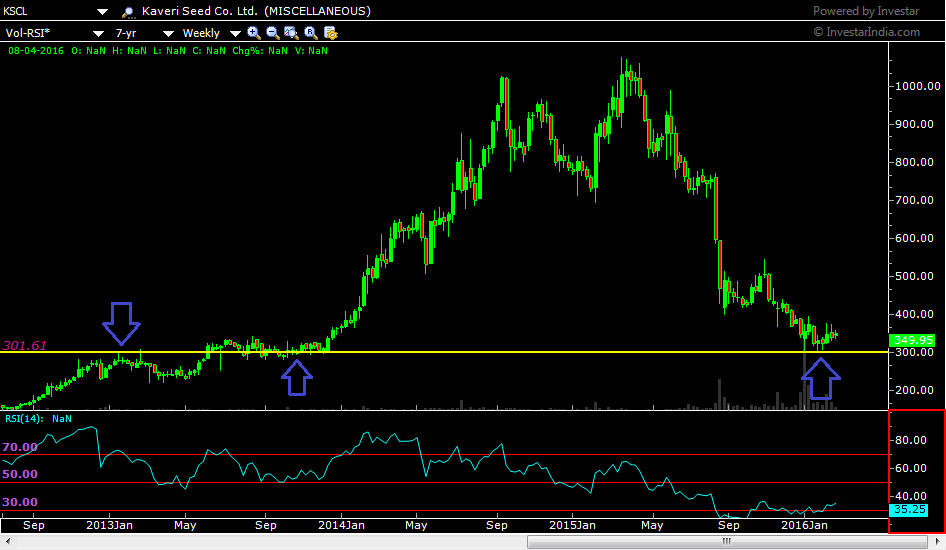
It is currently fluctuating very close to its 52 weeks low.

In the weekly chart of KSCL below, the level of 300 is drawn with a yellow line and we can see that this level has met with heavy activity in the past.

The arrows point of the instance when this level had acted as resistance first and then soon after as support.

Enroll in:  NSE Academy Certified Technical Analysis course on Elearnmarkets to become a technical analysis expert.

KSCL Weekly chart
CHART #2 : KSCL Weekly chart

Coming back to the symmetrical triangle drawn on the below chart #3, we will see that the base, the broadest part of the triangle, is a good 52 points wide, and if project that from the recent point of support in the pattern, we get the level of 390 at the target level on the upside.

You may ask, we are we assuming an upside breakout as there is no written rule for it.

The answer is, that the other pieces of evidence are giving a bullish indication.

On the chart of KSCL, let us observe the momentum indicator (RSI), which has given a very good positive divergence highlighted with white lines on Chart #3.

Read More:  RSI Indicator and How is it useful in Trading Stocks?

Also, the volumes have been consistently low as shown by the gray histogram lines on the chart right below the triangle.

Hence, in preparation for a breakout, we have prepared our action plan.

CHART #3: KSCL Daily, showing target, resistance at 390 and the support at 300

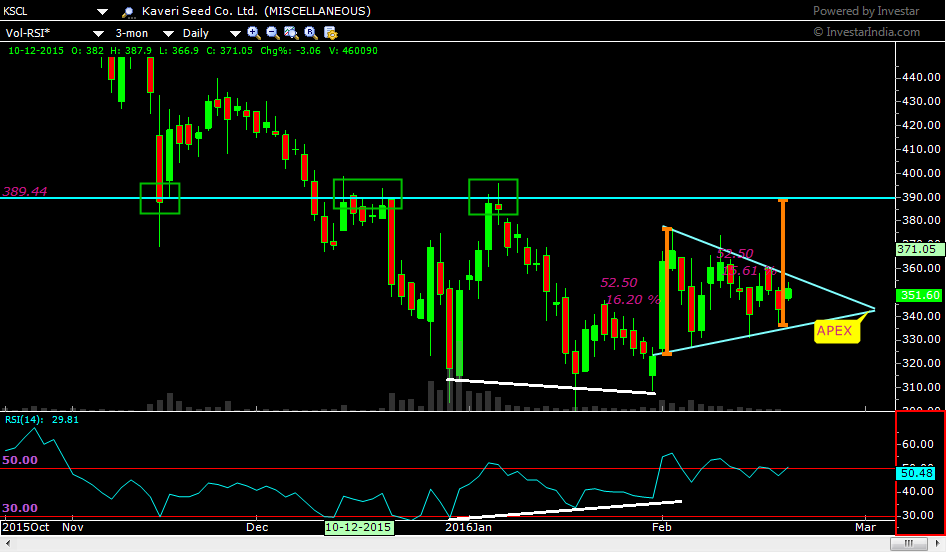
Also, on the chart, we see that 390 makes absolute sense as this level has been giving support to the price, in the range of consolidation, and the resistance point in the past.

Bottomline

Whether the prices move beyond the level of 390 is a question for later, but for now, we will await a breakout (hopefully with high volumes) and a rise upto 390.

Since depending on just one aspect is not enough when it comes to Technical Analysis, we have worked on the joint analysis of three indicators, RSI, Volumes, and chart patterns.


Tags: englishvolumes
ShareTweetSend
Subscribe To Updates On Telegram Subscribe To Updates On Telegram Subscribe To Updates On Telegram
Previous Post

Symmetrical Triangle / Coil pattern / Isoceles Triangle

Next Post

MARKET WRAP for 18th Feb, ‘16: Nifty volatile, Hero Moto races ahead!

Elearnmarkets

Elearnmarkets

Elearnmarkets (ELM) is a complete financial market portal where the market experts have taken the onus to spread financial education. ELM constantly experiments with new education methodologies and technologies to make financial education effective, affordable and accessible to all. You can connect with us on Twitter @elearnmarkets.

Related Posts

Hourly Chart
Market Analysis

Nifty Ends on Positive Note, Gains Approx. 475 Points on Positive Global Factors

November 18, 2020
373
Weekly Chart
Market Analysis

Huge Sell-Off Makes the Market Close in a Negative Note on the Expiry Week

November 18, 2020
172
Hourly Chart
Market Analysis

Nifty Ends in Green. Rupee Appreciates and Falling Crude Price Helped the Market to Recover Approx. 140 Point

November 18, 2020
126
Hourly Chart
Market Analysis

Sell Off Continues. Nifty Ends The Week With Three Consecutive Red Candles

November 18, 2020
137

Leave a Reply Cancel reply

Your email address will not be published. Required fields are marked *

Follow Us

Facebook-f Twitter Instagram Linkedin-in Youtube Telegram

Register on Elearnmarkets

Continue your financial learning by creating your own account on Elearnmarkets.com

Register Free Account

Download App

Categories

  • Basic Finance
  • Derivatives
  • Financial Planning
  • Fundamental Analysis
  • Technical Analysis
  • Marketshala
  • Miscellaneous

© 2022 Elearnmarkets . All Rights Reserved

  • Visit Elearnmarkets
  • Courses
  • Webinars
  • Financial Guides
  • Get Free Counselling

Get Elearnmarkets App

No Result
View All Result
  • Article Categories
    • Basic Finance
    • Derivatives
    • Financial Planning
    • Fundamental Analysis
    • Technical Analysis
    • Marketshala
    • Miscellaneous
  • Language
    • Hindi
    • Bengali
    • English
  • Courses
  • Webinars

© 2020 Elearnmarkets All Rights Reserved

Welcome Back!

Login to your account below

Forgotten Password?

Retrieve your password

Please enter your username or email address to reset your password.

Log In

Suggested Learning

Technical Analysis Made Easy

Certification in Online Technical Analysis

Online NSE Academy Certified Capital Market Professional (E-NCCMP)