Hindi: आप इस लेख को हिंदी में भी पढ़ सकते है|
Technical Indicators are usually of two types: leading and lagging indicator. These indicators are not limited to technical analysis and there are varieties of indicators as well such as inflation, wage, Employment etc.
To understand the technical indicators you need to learn Technical Analysis will ease the process of learning it. Leading indicators are those which precede the price movements of a security giving predictive qualities.
Today let us discuss some of the popular and leading technical indicators:
| Table of Contents |
|---|
| Trend Indicator |
| Momentum Technical Indicators |
| Volatility Indicators |
| Volume Indicators | Bottomline |
“Do not anticipate and move without market confirmation—being a little late in your trade is your insurance that you are right or wrong.” -Jesse Livermore
Leading Technical Indicators:
Leading Indicators can be trend indicators, momentum indicators, volatility indicators and volume indicators. Let us discuss these indicators:
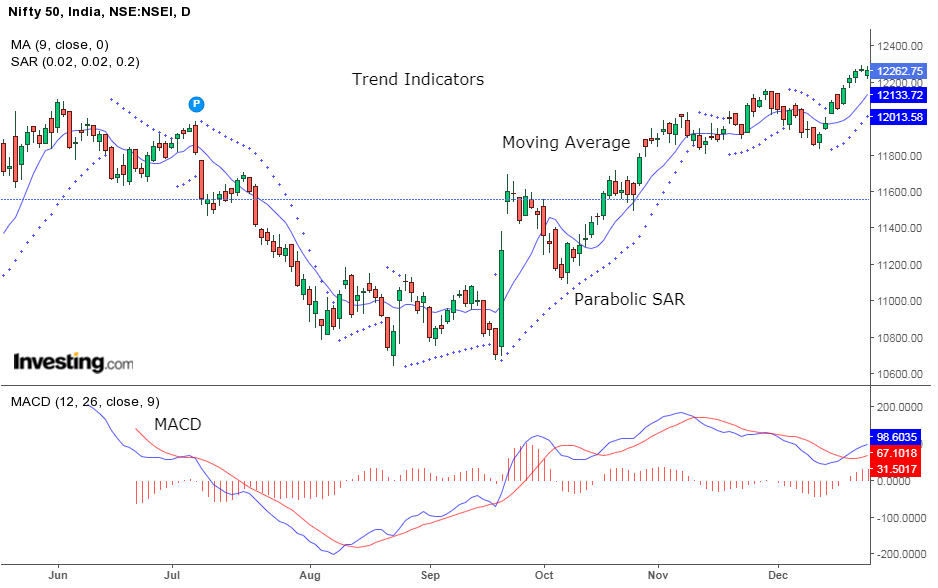
Trend Indicators
Trend Indicators determine the direction of the trend. In the case of a moving average, price data is smoothed and the trend is represented by a single line. Due to this smoothing process the indicators tend to lag price changes and are known as Trend following indicators. Some of the Trend following indicators are:
- Moving Averages
Moving Averages basically smooth price data by creating a single flowing line. This line represents the average price over a period of time. Which moving average to use, the trader decides by determining the time frame in which he/she trades.
There are several ways to use the moving averages such as looking at the angle of moving average and then crossovers of two moving averages.
- Moving Average Convergence Divergence (MACD)
The MACD is an oscillating indicator that fluctuates above and below zero. It is a trend following as well as momentum indicator.
One basic MACD strategy is to note at which side of zero the MACD lines are. Above zero then the trend is up, below zero then the trend is down. Buy signals occur when the MACD moves above zero and sell signals occur when it crosses below zero.
- Parabolic Stop And Reverse (Parabolic SAR)
Parabolic SAR is used to determine the direction of the price of a security. Developed by Welles Wilder it is also known as “stop and reverse system”.
This indicator is graphically shown as a series of dots on the chart placed either above or below the price. In the case of a downtrend a dots are placed above the price and in case of uptrend dots are placed below the price.
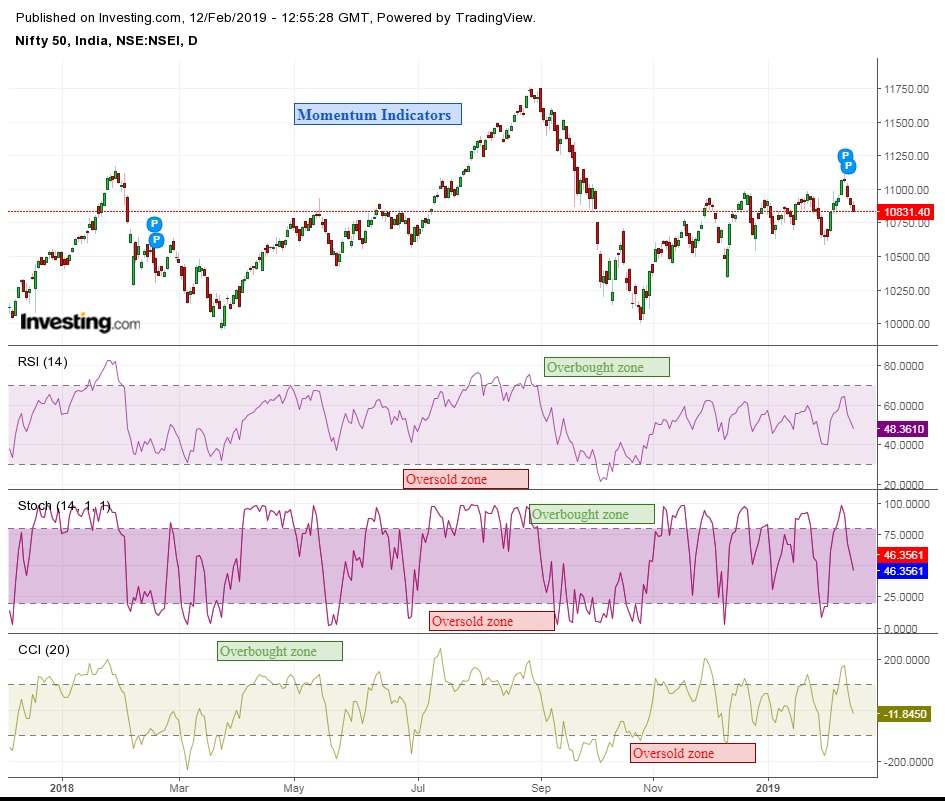
Momentum Technical Indicators
If you remember your physics class, then you can recall momentum being a measure of motion. In technical analysis momentum is a gauge of how quickly a market is moving giving certain factors.
Although their primary use is to gauge the strength of a trend, momentum indicators also indicate when a trend has slowed and possibly ready for a change.
Master your trading skills with Technical Trading Made Easy Course by Market Experts
The following are momentum indicators:
- Stochastic Oscillator
Stochastic is used to compare where the stock’s price closes over a selected number of periods. Usually a reading above 80 is considered to be overbought zone and a reading below 20 is considered to be oversold zone.
- Commodity Channel Index (CCI)
Another way to interpret a momentum indicator is through its speed and angle as it crosses the centre line. This can be done through Commodity Channel Index (CCI)
CCI is used to spot excess buying or selling pressure when it crosses above the 100 level or -100.
- Relative Strength Index (RSI)
Relative Strength Index (RSI) is a momentum indicator which compares the magnitude of a stock’s recent gains to the magnitude of its recent losses on a scale from 0 to 100.
It is calculated by taking the average of the closes of the up bars and then dividing them by the average of the closes of the down bars.
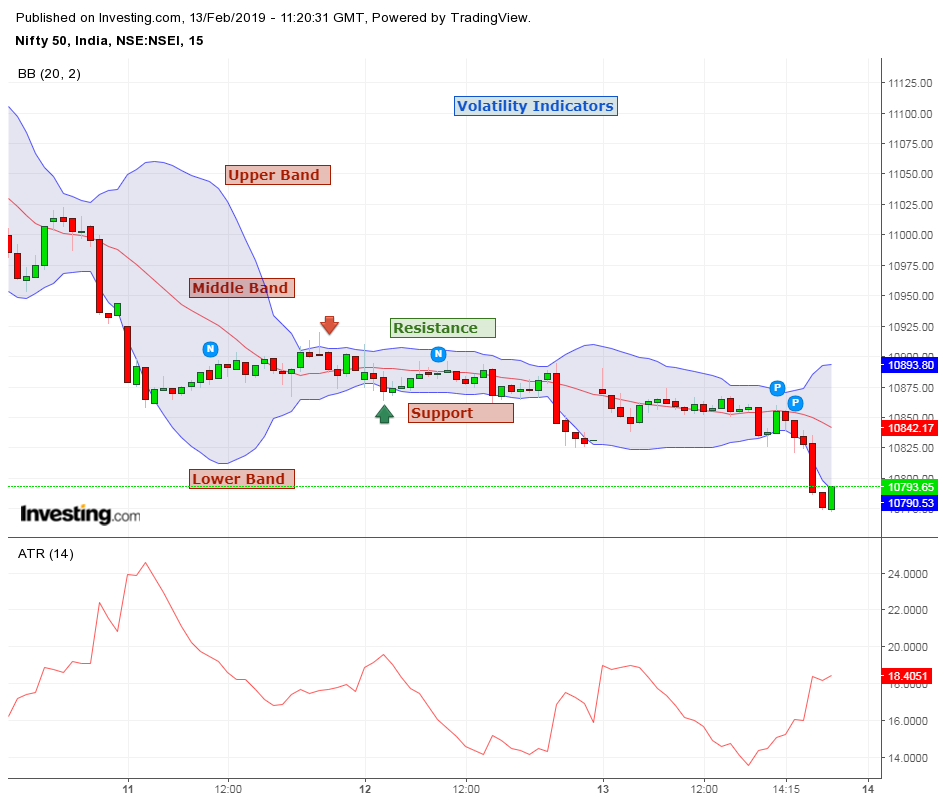
Volatility Indicators
Volatility indicators are valuable technical analysis tools which look at changes in market prices over a particular period of time. The faster prices change, the higher the volatility and similarly the slower prices change, the lower the volatility.
The following are some of the volatility indicators:
- Bollinger Bands
Bollinger bands are the indicator which creates a price band around the current market price. The market price’s relation to the price channel helps to determine what will happen next.
It consists of 3 lines:
- Moving average as the middle line:
The middle line acts as the support line when the prices are above the middle line. Similarly, when the prices are below the middle line, it acts as resistance.
- Upper and lower lines based on the standard deviations:
The upper line works as the resistance whereas the lower line works as the support.
- Average True Range
The Average True Range is a volatility indicator that measures the market volatility be decomposing the entire range of security’s price for that period.
A stock having a high level of volatility has a higher ATR and a low volatility stock has a lower ATR.
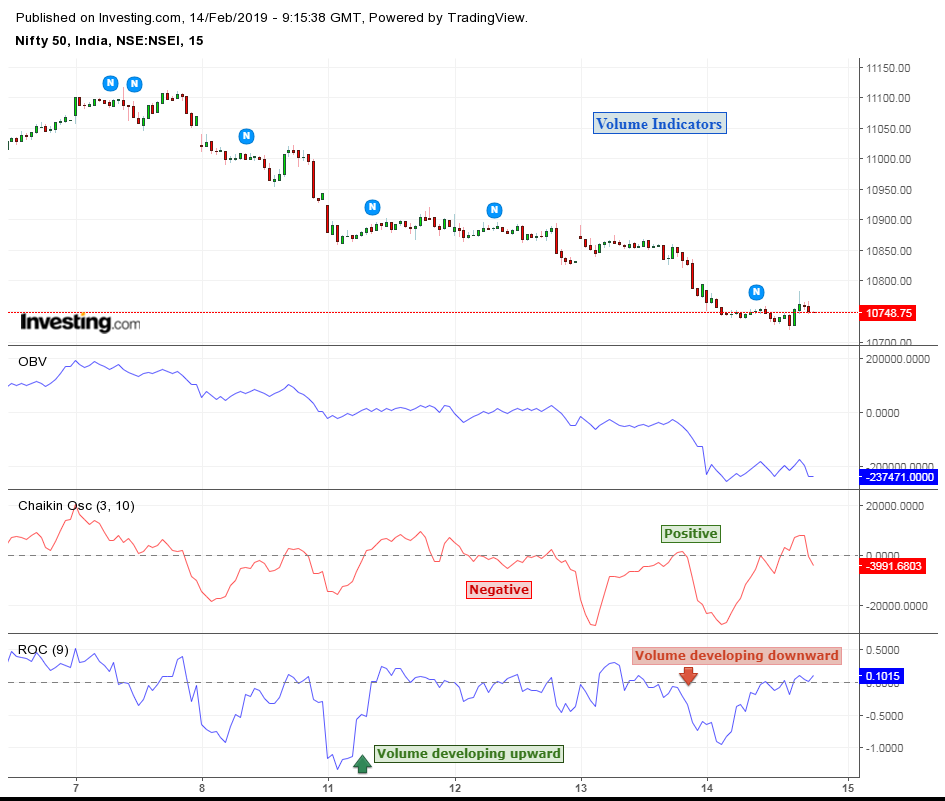
Volume Indicators
Volume indicators are those indicators which account for the volume. For stocks volume means the volume of executed trades.
The following are some of the volume indicators:
- Chaikin Oscillator
The purpose of this indicator is to identify momentum level amid the accumulation/distribution line of the MACD indicator. It is the MACD which is applied to the accumulation/distribution line rather than the closing prices.
This indicator generates a bullish divergence when it crosses above a baseline. This baseline is known as Accumulation/Distribution line. Similarly a negative divergence is confirmed with a centre line crossover.
- On-Balance Volume (OBV)
This indicator measures positive and negative volume flow. When the volume increases sharply without a significant change in the price of the stock then the price will jump up and when the volume decreases without a significant change in the price then the price will hump down.
- Volume Rate of Change
This is an indicator which shows whether or not a volume trend is developing in an upward or downward direction.
Bottomline
Indicators that are used in technical analysis of stocks provide an important sources of additional information. These indicators help to identify momentum, trends, volatility and other aspects in stock to help traders to make better investment decisions.
Want to learn Technical Analysis in Hindi? We are there for you. Join our technical analysis course in hindi and enhance your knowledge.


Good web site! I truly love how it is easy on my eyes and the data are well written. I’m wondering how I might be notified when a new post has been made. I have subscribed to your feed which must do the trick! Have a nice day!