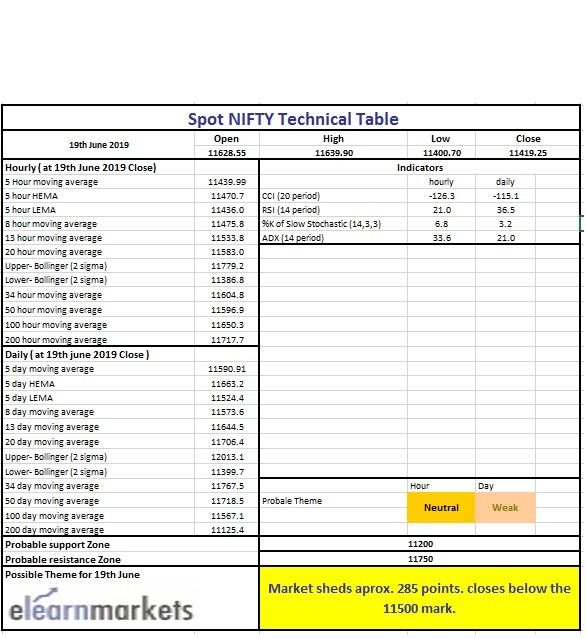
Market Wrap – Nifty breaches and closes below the 11500 mark on today’s trading session. For the last few weeks the market has been in a downtrend, and today it closes below its 100MA. Apart from the 200MA, all the MAs are trading above the price. If the index continues the selloff, 11200 level likely to act as possible support. In case any pullback takes place, mid-Bollinger line (presently at approx. 11706 level) likely to act as a dynamic resistance.
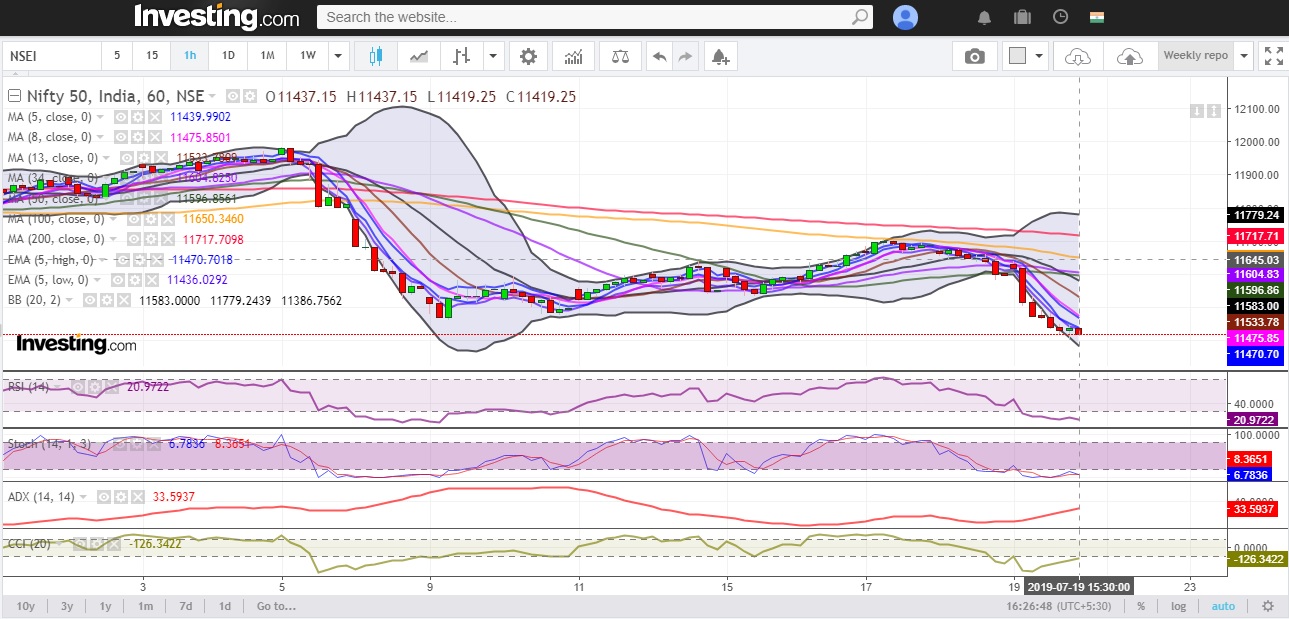
(Market wrap) Hourly Technical: Weakness is visible in the Hourly chart. Most of the important MAs are trading above the price and other technical parameters like RSI and Stochastic are trading their oversold level, which refers to the weakness. ADX is rising and it is above 30 level, which suggests the trend (down) has the strength to extend further.
In case the index continues its downtrend 11385 would be its possible support level as per the Fib Extension. But we can take the 11350 because it is a psychological as well as a technical support level. In case any pullback happens, Mid Bollinger (presently at approx. 11583 level) would be the potential resistance for the price.
Hourly chart
(Market Wrap) Daily Technical: The daily chart is carrying the same characteristics as the Hourly chart does. The trend is down, the latest close is below the 100MA and technical indicators are slopping downwards.
Indicator RSI is below 40, Stochastic is at below 5 mark, ADX has started rising and it is above 20 and the CCI is below -100.
Overall the weakness is there. if the index breaches below the today’s low (which is at 11400.70) level another fresh sell-off might be witnessed.
For the support, we can take the 11200 level (derived from the price action) and we can also rely on the 200MA (presently at approx. 11125.38 level)
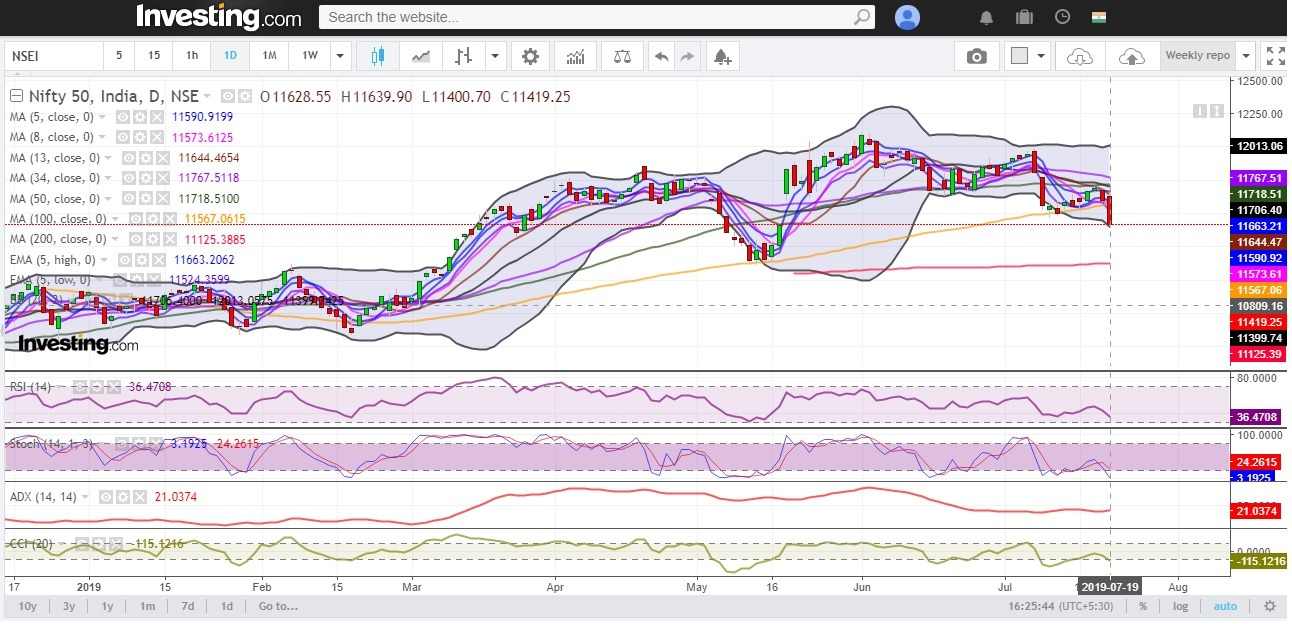
Daily chart
(Market wrap) Weekly Technical: As we mentioned earlier in our previous article that the weekly chart had a negative divergence and this could be the technical reason behind the sell-off.
This week market ends below the weekly mid-Bollinger (suggest strong weakness) and this might make the Bears happy. But, longer-term MAs like 34, 50, 100 and the 200MA are still trading below the price. So there will be support in case the downtrend continues.
In the market wrap we can witness that most of the indicators are slopping downward just like we witnessed in the daily chart. RSI is below 50, Stochastic is near its 30 level, ADX is not trending (trading at 14 level) and the CCI is below 0.
So as of now, we can see the weakness is about to take place but there would be multiple supports. 11000 is the psychological as well as technical support and apart from that 50MA (trading at approx. 11174.33 level), 100MA (trading at approx. 10824.38) likely to act as a potential support level.
On the other hand, if the index starts moving upward, 11750 level would be an important resistance zone.
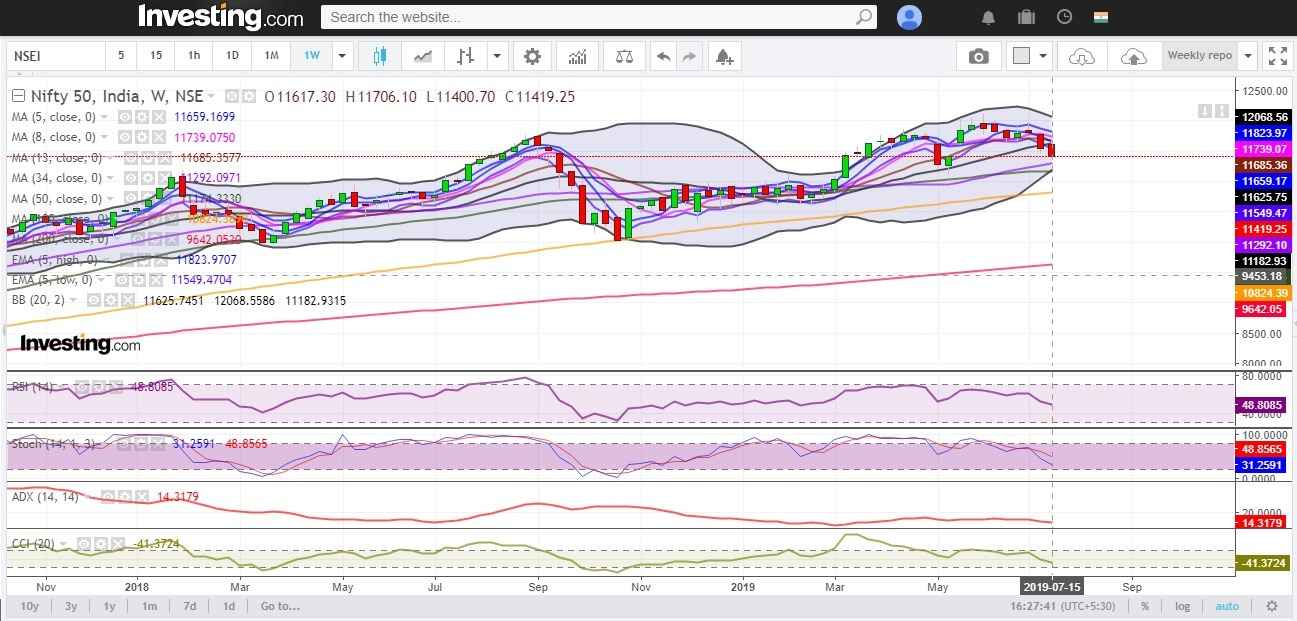
Weekly chart

BOTTOMLINE
You can use stockedge app to get cutting edge over others in both short term trading and investing. Here you not only get data at one particular place but can also create your own combination scans based on your own technical and fundamental parameter. See the video above to know about various features in Stockedge app. Also visit Stockedge website.
Read more blogs from our website Elearnmarkets.


