Elearnmarkets - Financial Market Learning
  • Categories
    • Basic Finance
    • Derivatives
    • Financial Planning
    • Fundamental Analysis
    • Technical Analysis
    • Marketshala
    • Miscellaneous
  • Language
    • English
    • Hindi
    • Bengali
No Result
View All Result
  • Courses
  • Webinars
  • Go To Site
  • Login
Elearnmarkets
  • Categories
    • Basic Finance
    • Derivatives
    • Financial Planning
    • Fundamental Analysis
    • Technical Analysis
    • Marketshala
    • Miscellaneous
  • Language
    • English
    • Hindi
    • Bengali
No Result
View All Result
Webinars
Elearnmarkets - Learn Stock Market, trading, investing for Free
No Result
View All Result
Home Technical Analysis Market Analysis

MARKET WRAP for 15th Feb, ’16: Nifty rebounds after a week of sell-off

Elearnmarkets by Elearnmarkets
January 20, 2023
in Market Analysis, Market Wrap
Reading Time: 2 mins read
0
24
VIEWS
Share on FacebookShare on TwitterShare on WhatsApp

Nifty opened with a good upside gap of nearly a 100 points and maintained the rally for first half of the day. From 1.30 pm onwards a consolidation in the range of 7150-7185 was witnessed.

On the daily chart of Nifty, we saw a hammer pattern formed on Friday. Today there has been a very good rebound which took the index some 2.54% higher which was 177 points up, closing just above 7150 at 7158. However , if we look at the momentum indicator, not much hope comes to us as the index had breached the level 30 previous day and this indicates that weakness is still to follow.  On the upside also, we have a resistance in the zone of 7250-7265 to look for in Nifty.

Taking a look at the sectoral performance, the banks were very bullish today, with the positive comments coming in from Bank of Baroda’s management  and the government’s word of providing a meaty provision to the banking sector . However it was not just the Indian banks that were up but also European and Japanese banks.  What we saw today was more of a sentimental wave than the real picture.

The steel sector was also on fire , specifically Vedanta and TATA Steel. The European union (EU) has imposed anti dumping duty on steel which is a positive news for the European subsidiary of Tata Steel.

The IT Sector kept to the sidelines today instead of participating in the rally. So was the pharmaceutical sector.
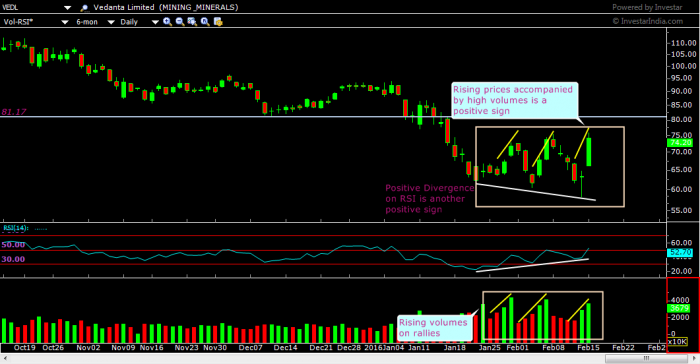
CHART OF THE DAY

Vedanta gave a very good bounce today . It closed 18% higher from yesterday. There are a couple of positive technical indicators, let’s discuss them in details.

The volumes are giving a very good indication on this chart. On every rally, the volume had also picked up which is a sign of heavy accumulation happening at the support zone of 60-65. Other than that, inspite of consecutive lower lows registered by the price, the moemtnum indicator RSI has formed higher highs that too at good levels above the dangerous 30 zone.

Vedanta
Vedanta


Thank you.


————————————————————————————————————————————————————


Read more articles here:

http://www.elearnmarkets.com/blog/market/nifty-chart/

http://www.elearnmarkets.com/blog/market/nifty-live/

http://www.elearnmarkets.com/blog/market/nifty-live-chart/


Tags: englishniftytechnical analysis
ShareTweetSend
Subscribe To Updates On Telegram Subscribe To Updates On Telegram Subscribe To Updates On Telegram
Previous Post

Union Budget Demystified!!

Next Post

MARKET WRAP for 16th Feb, ’16: Nifty undergoes profit booking

Elearnmarkets

Elearnmarkets

Elearnmarkets (ELM) is a complete financial market portal where the market experts have taken the onus to spread financial education. ELM constantly experiments with new education methodologies and technologies to make financial education effective, affordable and accessible to all. You can connect with us on Twitter @elearnmarkets.

Related Posts

Hourly Chart
Market Analysis

Nifty Ends on Positive Note, Gains Approx. 475 Points on Positive Global Factors

November 18, 2020
372
Weekly Chart
Market Analysis

Huge Sell-Off Makes the Market Close in a Negative Note on the Expiry Week

November 18, 2020
169
Hourly Chart
Market Analysis

Nifty Ends in Green. Rupee Appreciates and Falling Crude Price Helped the Market to Recover Approx. 140 Point

November 18, 2020
125
Hourly Chart
Market Analysis

Sell Off Continues. Nifty Ends The Week With Three Consecutive Red Candles

November 18, 2020
136

Leave a Reply Cancel reply

Your email address will not be published. Required fields are marked *

Follow Us

Facebook-f Twitter Instagram Linkedin-in Youtube Telegram

Download App

Register on Elearnmarkets

Continue your financial learning by creating your own account on Elearnmarkets.com

Register Free Account

Get Articles On Email

Enter your email address:

Categories

  • Basic Finance
  • Derivatives
  • Financial Planning
  • Fundamental Analysis
  • Technical Analysis
  • Marketshala
  • Miscellaneous

© 2022 Elearnmarkets . All Rights Reserved

  • Visit Elearnmarkets
  • Courses
  • Webinars
  • Financial Guides
  • Get Free Counselling

Get Elearnmarkets App

No Result
View All Result
  • Article Categories
    • Basic Finance
    • Derivatives
    • Financial Planning
    • Fundamental Analysis
    • Technical Analysis
    • Marketshala
    • Miscellaneous
  • Language
    • Hindi
    • Bengali
    • English
  • Courses
  • Webinars

© 2020 Elearnmarkets All Rights Reserved

Welcome Back!

Login to your account below

Forgotten Password?

Retrieve your password

Please enter your username or email address to reset your password.

Log In

Suggested Learning

Technical Analysis Made Easy

Certification in Online Technical Analysis

Online NSE Academy Certified Capital Market Professional (E-NCCMP)