Elearnmarkets - Financial Market Learning
  • Categories
    • Basic Finance
    • Derivatives
    • Financial Planning
    • Fundamental Analysis
    • Technical Analysis
    • Marketshala
    • Miscellaneous
  • Language
    • English
    • Hindi
    • Bengali
No Result
View All Result
  • Courses
  • Webinars
  • Go To Site
  • Login
Elearnmarkets
  • Categories
    • Basic Finance
    • Derivatives
    • Financial Planning
    • Fundamental Analysis
    • Technical Analysis
    • Marketshala
    • Miscellaneous
  • Language
    • English
    • Hindi
    • Bengali
No Result
View All Result
Webinars
Elearnmarkets - Learn Stock Market, trading, investing for Free
No Result
View All Result
Home Technical Analysis Market Analysis Market Wrap

MARKET WRAP for Thurs-21st Jan , 2016: Nifty opens fair, but drags soon enough

Elearnmarkets by Elearnmarkets
January 20, 2023
in Market Wrap, Market Analysis
Reading Time: 2 mins read
0
401
VIEWS
Share on FacebookShare on TwitterShare on WhatsApp

Bottom Line

Market Wrap For Thurs- 21st Jan ,2016 NSE index NIFTY posted an optimistic opening, but lost the gains immediately on weak global cues.

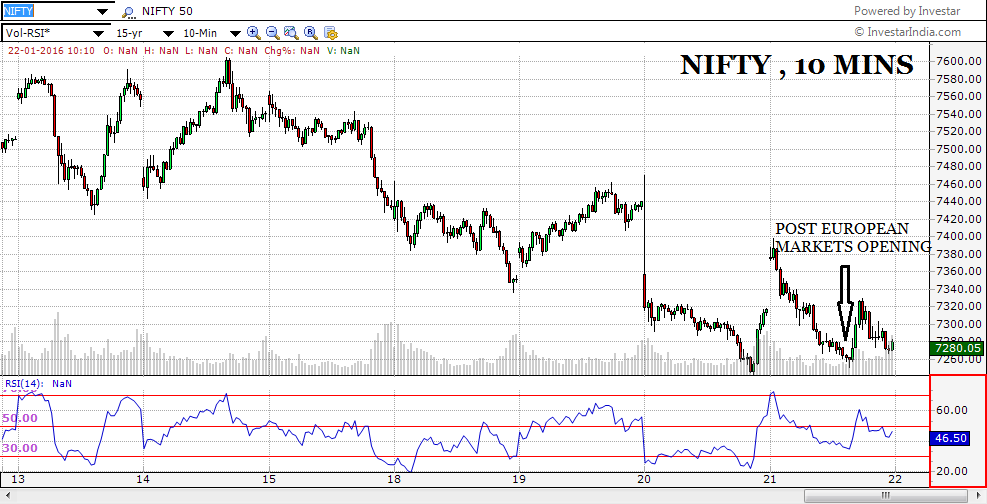
The Market Wrap  shows that the it lost nearly 50 points being subjected to selling pressure in the first half. Some relief came in around 1:30pm when the European Markets opened, however the same could not be sustained and Nifty slipped lower still finally closing at 7280, after a loss of 30 points from yesterday’s close.

It is evident that the Indian stock market is subjected to immense emotional turmoil. The international markets, combined with rising gold prices is confusing investors and bringing about erratic moves in the market.

On the daily chart of Nifty, we see that the support line has been breached and today the closing was below it. What kept some buoyancy in the market , apart from the positive European Market opening, was a favourable result from the NIFTY 50 stock, AXIS BANK. However, the question comes, will this continue? What the chart says is that the move shown by Axis Bank today, was not confirmed by the Momentum indicator, RSI. A negative Divergence was spotted on the intraday 10 mins chart, hinting to weakness.

On the International front, we had the Chinese Shanghai Composite Index losing 3%, Hang seng down by 1.8%, The European Indices were buoyant thus providing support to the Indian Indices as well, which managed only a mildly negative closing.

CHART OF THE DAY 

BPCL, Bharat Petroleum , saw much weakness today. The charts show that in-spite of much efforts to keep the support trendline intact, the selling pressure witnessed in the last 4 days finally managed to break below the same yesterday, and give a closing even lower today.

On the charts we see that initially, there was a pullback to the resistance trendline however due to weakness in the crude oil prices which has been much in talk since a few months, BPCL had falled lower still till the support. The upward trending channel has given a downside breakout which may lead to another down-leg of the kind we can see on the chart.

Market Wrap


Market Wrap for Thurs-21st Jan 2016 https://www.elearnmarkets.com/blog/market-wrap-for-thurs-21st-jan-2016/

Also visit on our webpage https://stockedge.com/ for further updates.

Tags: englishniftytechnical analysis
ShareTweetSend
Subscribe To Updates On Telegram Subscribe To Updates On Telegram Subscribe To Updates On Telegram
Previous Post

12 reasons for Dishonour of Cheque

Next Post

Top 7 Benefits of Bank Account you should know

Elearnmarkets

Elearnmarkets

Elearnmarkets (ELM) is a complete financial market portal where the market experts have taken the onus to spread financial education. ELM constantly experiments with new education methodologies and technologies to make financial education effective, affordable and accessible to all. You can connect with us on Twitter @elearnmarkets.

Related Posts

Hourly Chart
Market Analysis

Nifty Ends on Positive Note, Gains Approx. 475 Points on Positive Global Factors

November 18, 2020
373
Weekly Chart
Market Analysis

Huge Sell-Off Makes the Market Close in a Negative Note on the Expiry Week

November 18, 2020
172
Hourly Chart
Market Analysis

Nifty Ends in Green. Rupee Appreciates and Falling Crude Price Helped the Market to Recover Approx. 140 Point

November 18, 2020
126
Hourly Chart
Market Analysis

Sell Off Continues. Nifty Ends The Week With Three Consecutive Red Candles

November 18, 2020
137

Leave a Reply Cancel reply

Your email address will not be published. Required fields are marked *

Follow Us

Facebook-f Twitter Instagram Linkedin-in Youtube Telegram

Register on Elearnmarkets

Continue your financial learning by creating your own account on Elearnmarkets.com

Register Free Account

Download App

Categories

  • Basic Finance
  • Derivatives
  • Financial Planning
  • Fundamental Analysis
  • Technical Analysis
  • Marketshala
  • Miscellaneous

© 2022 Elearnmarkets . All Rights Reserved

  • Visit Elearnmarkets
  • Courses
  • Webinars
  • Financial Guides
  • Get Free Counselling

Get Elearnmarkets App

No Result
View All Result
  • Article Categories
    • Basic Finance
    • Derivatives
    • Financial Planning
    • Fundamental Analysis
    • Technical Analysis
    • Marketshala
    • Miscellaneous
  • Language
    • Hindi
    • Bengali
    • English
  • Courses
  • Webinars

© 2020 Elearnmarkets All Rights Reserved

Welcome Back!

Login to your account below

Forgotten Password?

Retrieve your password

Please enter your username or email address to reset your password.

Log In

Suggested Learning

Technical Analysis Made Easy

Certification in Online Technical Analysis

Online NSE Academy Certified Capital Market Professional (E-NCCMP)