Elearnmarkets - Financial Market Learning
  • Categories
    • Basic Finance
    • Derivatives
    • Financial Planning
    • Fundamental Analysis
    • Technical Analysis
    • Marketshala
    • Miscellaneous
  • Language
    • English
    • Hindi
    • Bengali
No Result
View All Result
  • Courses
  • Webinars
  • Go To Site
  • Login
Elearnmarkets
  • Categories
    • Basic Finance
    • Derivatives
    • Financial Planning
    • Fundamental Analysis
    • Technical Analysis
    • Marketshala
    • Miscellaneous
  • Language
    • English
    • Hindi
    • Bengali
No Result
View All Result
Webinars
Elearnmarkets - Learn Stock Market, trading, investing for Free
No Result
View All Result
Home Technical Analysis Market Analysis

Market Wrap for 4th Mar, ’16: Nifty loses steam, Midcaps outperform

Elearnmarkets by Elearnmarkets
November 18, 2020
in Market Analysis, Market Wrap
Reading Time: 2 mins read
0
48
VIEWS
Share on FacebookShare on TwitterShare on WhatsApp

Nifty has given a wonderful week. closing 6.5% higher from the previous week. Today however nifty seemed to be ending that Post Budget sprint, and ended forming a Japanese Candle stick pattern, the Dragonfly Doji . The High, close and opening of the day were close to 7500. Yesterday we had mentioned that there are signs of weakness and following that, we saw the momentum indicator RSI ending at the 60 level. 

On the intraday 30 mins chart of Nifty, a positive divergence has crept in on RSI indicating weakness.

Among the rest of the NSE Indices we see the Nifty Midcap 50 and BankNIfty outperformed the markets each closing some 1.40% higher. The NiftyRealty sector had been trading very bullish the entire week, closing some 3-4% up, but today was only a percent higher.

Subscribe To Webinars Subscribe To Webinars Subscribe To Webinars

On the list of winners we have Justdial leading with a 15% higher closing, followed by kaveri sed which gave a rally of 10% today. The list of bank follows with Syndicate Bank, Oriental bank of commerce , allahabad bank and PNB in the procession.

Looking at some of the winners we see that Justdial has come to the resistance trendline we mentioned yesterday . Kaveri seeds has rallied post the symmetrical triangle mentioned in a previous article. PNB has come out of the bottom with fair volumes support and Vedanta, though crossed out level of 81 and touched 90 today, a spinning top seems to be subdueing the momentum on the chart.

On the list of losers we saw Motherson Sumi down 5%, followed by the IT stocks like Techm, Hcl Technologies losing to the tunes of 2-2.5%.

CHART OF THE DAY

RELIANCE
RELIANCE

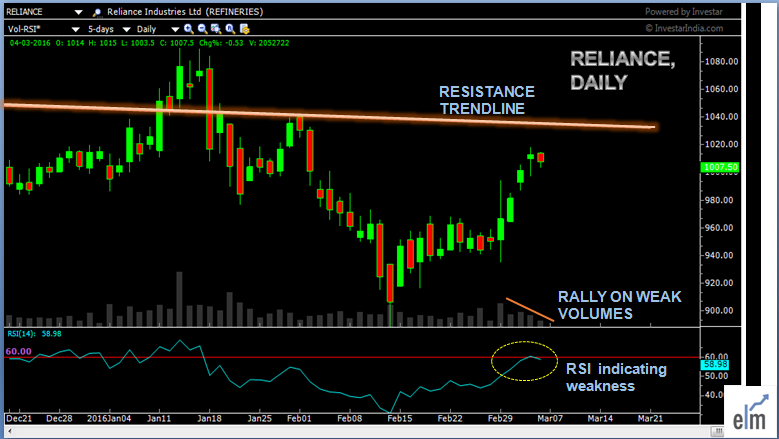
Reliance Industries saw some cooling off today as it approaches the resistance trendline. The rally witnessed in the past few days was on poor volumes and even the RSI indicator has faired poorly on the stock’s chart, having turned lower from the level of 60.

_____________________________________________________________________________________________________________________________


Read more articles here:

http://www.elearnmarkets.com/blog/market/nifty-chart/

http://www.elearnmarkets.com/blog/market/nifty-live/

http://www.elearnmarkets.com/blog/market/nifty-live-chart/

Tags: englishniftyvolumes
ShareTweetSend
Subscribe To Updates On Telegram Subscribe To Updates On Telegram Subscribe To Updates On Telegram
Previous Post

LIC Housing Finance: Volumes Indicate Weakness in the Trend

Next Post

Depository Receipts – Complete Understanding of ADR and GDR

Elearnmarkets

Elearnmarkets

Elearnmarkets (ELM) is a complete financial market portal where the market experts have taken the onus to spread financial education. ELM constantly experiments with new education methodologies and technologies to make financial education effective, affordable and accessible to all. You can connect with us on Twitter @elearnmarkets.

Related Posts

Hourly Chart
Market Analysis

Nifty Ends on Positive Note, Gains Approx. 475 Points on Positive Global Factors

November 18, 2020
373
Weekly Chart
Market Analysis

Huge Sell-Off Makes the Market Close in a Negative Note on the Expiry Week

November 18, 2020
171
Hourly Chart
Market Analysis

Nifty Ends in Green. Rupee Appreciates and Falling Crude Price Helped the Market to Recover Approx. 140 Point

November 18, 2020
126
Hourly Chart
Market Analysis

Sell Off Continues. Nifty Ends The Week With Three Consecutive Red Candles

November 18, 2020
137

Leave a Reply Cancel reply

Your email address will not be published. Required fields are marked *

Follow Us

Facebook-f Twitter Instagram Linkedin-in Youtube Telegram

Register on Elearnmarkets

Continue your financial learning by creating your own account on Elearnmarkets.com

Register Free Account

Download App

Categories

  • Basic Finance
  • Derivatives
  • Financial Planning
  • Fundamental Analysis
  • Technical Analysis
  • Marketshala
  • Miscellaneous

© 2022 Elearnmarkets . All Rights Reserved

  • Visit Elearnmarkets
  • Courses
  • Webinars
  • Financial Guides
  • Get Free Counselling

Get Elearnmarkets App

No Result
View All Result
  • Article Categories
    • Basic Finance
    • Derivatives
    • Financial Planning
    • Fundamental Analysis
    • Technical Analysis
    • Marketshala
    • Miscellaneous
  • Language
    • Hindi
    • Bengali
    • English
  • Courses
  • Webinars

© 2020 Elearnmarkets All Rights Reserved

Welcome Back!

Login to your account below

Forgotten Password?

Retrieve your password

Please enter your username or email address to reset your password.

Log In

Suggested Learning

Technical Analysis Made Easy

Certification in Online Technical Analysis

Online NSE Academy Certified Capital Market Professional (E-NCCMP)