Elearnmarkets - Financial Market Learning
  • Categories
    • Basic Finance
    • Derivatives
    • Financial Planning
    • Fundamental Analysis
    • Technical Analysis
    • Marketshala
    • Miscellaneous
  • Language
    • English
    • Hindi
    • Bengali
No Result
View All Result
  • Courses
  • Webinars
  • Go To Site
  • Login
Elearnmarkets
  • Categories
    • Basic Finance
    • Derivatives
    • Financial Planning
    • Fundamental Analysis
    • Technical Analysis
    • Marketshala
    • Miscellaneous
  • Language
    • English
    • Hindi
    • Bengali
No Result
View All Result
Webinars
Elearnmarkets - Learn Stock Market, trading, investing for Free
No Result
View All Result
Home Technical Analysis Market Analysis Charts
Rising Wedge Pattern

MARUTI forms a Classic Rising Wedge Pattern !

Elearnmarkets by Elearnmarkets
November 18, 2020
in Charts, Market Analysis
Reading Time: 2 mins read
0
425
VIEWS
Share on FacebookShare on TwitterShare on WhatsApp

The market in general has been falling since March 2015, however MARUTI started buckling only recently, from the end of December 2015.

If we look at the chart of MARUTI, we can see a clear indication of a topping out, which could have served a very good warning to the investors to exit before the the stock started bleeding red.

MARUTI shows off a Rising Wedge

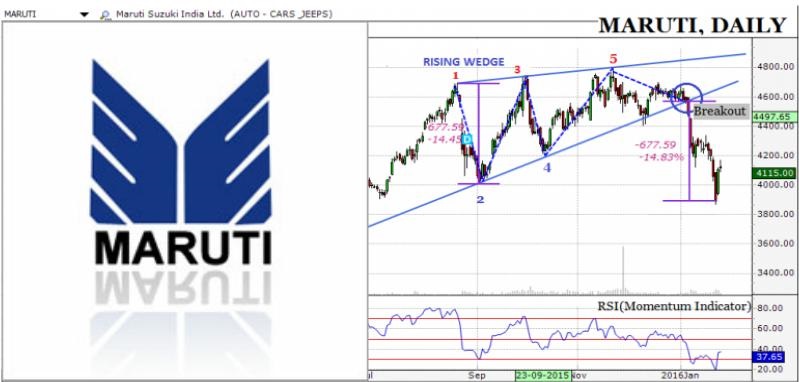
On the chart of MARUTI we see the formation of the ‘Rising Wedge’ pattern.  The name of the pattern comes from the fact that both the upward bounding resistance trendline and the lower bounding support trendline are angled upwards and appear to be ‘Rising’. Within the bounds a lot of activity is witnessed, with the prices bouncing off from the bounding lines several times before finally breaking out in a particular direction. The Rising Wedge is predominantly a reversal pattern. If it appears after an uptrend, like in this case, it gives a downside breakout, thus ending in a reversal of the price trend. A rising wedge can also occur in a downtrend, as a counter trend movement and ends up with again a downside breakout thereby resulting in a continuation of the main trend.

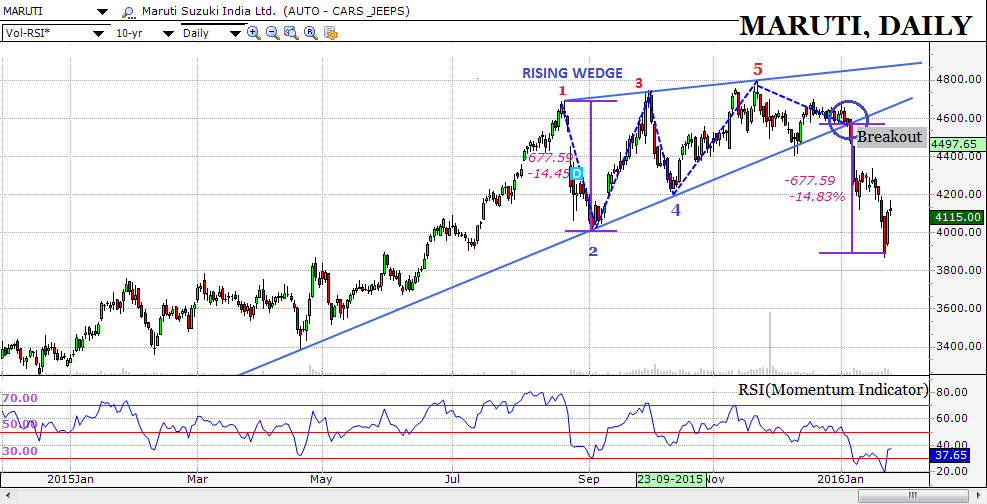
On the daily chart of MARUTI, the Rising Wedge pattern developed successfully, registering 5 contact points and finally breaking below the supporting line. The target level post such breakout is the base of the wedge , that is the length of the first wave, which in this case is ~677 points as marked by the violet price line. On the chart, we see that MARUTI has very well achieved this target level , taken support at the same, and bounced upward.

Other than the presence of the chart pattern, the momentum indicator, RSI had also hinted about the formation of a top.
maruti 25.01.16 2
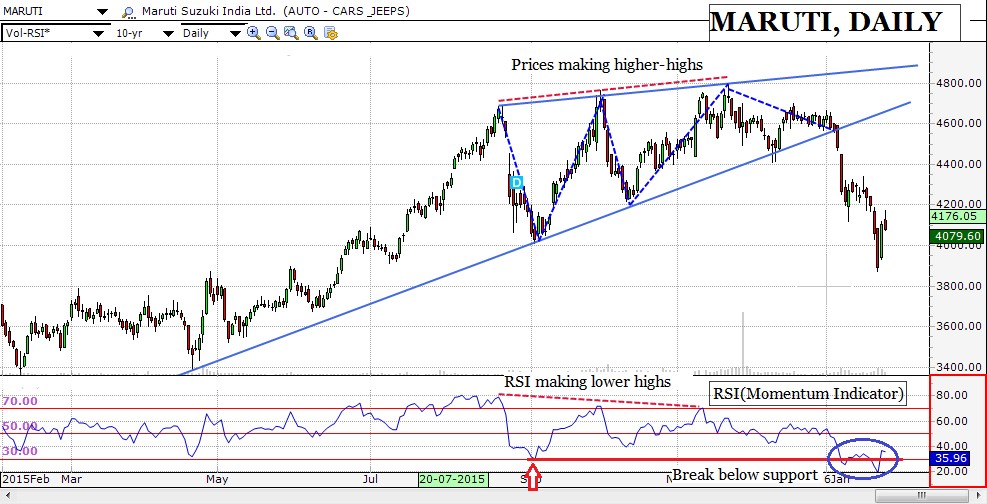
In the above chart we can see that the price of MARUTI had registered higher peaks consecutively, or ‘higher-highs’ , however on the RSI indicator, lower consecutive peaks , or ‘lower-highs’, were seen forming. This is called a ‘Negative Divergence’ which indicates the weakening of underlying upside momentum and is often a cause of worry. Post the breakout also, we saw the RSI tumbling very fast, thus emphasizing the weakness in the price of MARUTI’s stock. It also broke below previous support and the important zone of 30.

We appreciate your interest in learning about the financial market. Do leave your comments and valuable feedback below in the comments section.  

DISCLAIMER: This article is written purely for educational purpose and does not intend the disbursement of any trading or investment tip. Kindly consult your financial advisory before investing as it may result in a loss of capital.


Tags: englishmomentum indicatorrising wedgersitechnical analysis
ShareTweetSend
Subscribe To Updates On Telegram Subscribe To Updates On Telegram Subscribe To Updates On Telegram
Previous Post

Moats vs Floats

Next Post

MARKET WRAP (25th Jan): Nifty performance today ,FOMC meeting ahead, Cairn India quarterly results and more…

Elearnmarkets

Elearnmarkets

Elearnmarkets (ELM) is a complete financial market portal where the market experts have taken the onus to spread financial education. ELM constantly experiments with new education methodologies and technologies to make financial education effective, affordable and accessible to all. You can connect with us on Twitter @elearnmarkets.

Related Posts

Hourly Chart
Market Analysis

Nifty Ends on Positive Note, Gains Approx. 475 Points on Positive Global Factors

November 18, 2020
373
Weekly Chart
Market Analysis

Huge Sell-Off Makes the Market Close in a Negative Note on the Expiry Week

November 18, 2020
172
Hourly Chart
Market Analysis

Nifty Ends in Green. Rupee Appreciates and Falling Crude Price Helped the Market to Recover Approx. 140 Point

November 18, 2020
126
Hourly Chart
Market Analysis

Sell Off Continues. Nifty Ends The Week With Three Consecutive Red Candles

November 18, 2020
137

Leave a Reply Cancel reply

Your email address will not be published. Required fields are marked *

Follow Us

Facebook-f Twitter Instagram Linkedin-in Youtube Telegram

Register on Elearnmarkets

Continue your financial learning by creating your own account on Elearnmarkets.com

Register Free Account

Download App

Categories

  • Basic Finance
  • Derivatives
  • Financial Planning
  • Fundamental Analysis
  • Technical Analysis
  • Marketshala
  • Miscellaneous

© 2022 Elearnmarkets . All Rights Reserved

  • Visit Elearnmarkets
  • Courses
  • Webinars
  • Financial Guides
  • Get Free Counselling

Get Elearnmarkets App

No Result
View All Result
  • Article Categories
    • Basic Finance
    • Derivatives
    • Financial Planning
    • Fundamental Analysis
    • Technical Analysis
    • Marketshala
    • Miscellaneous
  • Language
    • Hindi
    • Bengali
    • English
  • Courses
  • Webinars

© 2020 Elearnmarkets All Rights Reserved

Welcome Back!

Login to your account below

Forgotten Password?

Retrieve your password

Please enter your username or email address to reset your password.

Log In

Suggested Learning

Technical Analysis Made Easy

Certification in Online Technical Analysis

Online NSE Academy Certified Capital Market Professional (E-NCCMP)