
Hindi: आप इस लेख को हिंदी में भी पढ़ सकते है|
Multi time frame analysis is one of the most important things one should do before taking any trade. This analysis is one of the simplest tools of technical analysis that will help you reduce loss from your trades.
In order to make you remember this, let us start this blog by telling you a true story: –
If you live in an area where there is bad weather for some days in a row, then you will be able to understand the importance of knowing what the weather will be like if you plan an outdoor activity like any sports event, picnic, etc.
One day I was planning an outdoor activity that required no rain, snow, winds, thunderstorms, etc.
It required beautiful sunny weather at around 4 p.m.
So at 8 a.m., it was a beautiful sunny day with birds chirping.
But 4 p.m. was still 8 hours away.
| Table of Contents |
|---|
| What Multi Time Frame Trading you should be tracking? |
| Trading Example |
| Entry Principle for Multi Time Frame Analysis |
| Benefits of Multi Time Frame Trading Analysis |
So when I zoom out of the weather radar to see if the weather would be the same at 4 p.m also then guess what I found:
Thunderstorms were heading quickly and this horrible weather was going to take place around that area.
Now let us relate this example with trading. If we had not zoomed out at a larger frame then we won’t be able to notice the changes which could have taken place.
The above scenario can be compared to the Multi Time Frame Analysis. We should do this as traders on our charts every time we trade.
What Multi Time Frame Trading you should be tracking?
The general rule is that the longer the multi-timeframe analysis the more reliable signals are. As we reduce the time frames, the charts may give false signals. Ideally, traders should use a long time frame to define the trend of the stocks they are trading.
Once the trend is defined then the traders can use any time frame which they prefer to identify the intermediate trend and a faster time frame to identify the short-term trend.
Learn in 2 hours : Multi Time Frame Trading Strategies
Some examples of putting different time frames into use are:
- Swing trader who focuses on daily charts can use weekly charts to identify the primary trend and 60 minutes charts for identifying the short term trend.
- The day trader can use 60 minutes chart to identify the primary trend and a five-minute chart to identify the short term trend.
- Positional Trader can focus on weekly charts, use monthly charts to identify the primary trend and daily charts to identify the entries and exits.
The selection of which time frame to use depends upon each trader.
A trader should choose the multi-timeframe analysis which they are interested in and then choose a time frame above or below to compliment the time frame.
Trading Example:
Do not get caught in taking trades in just a one-time frame.
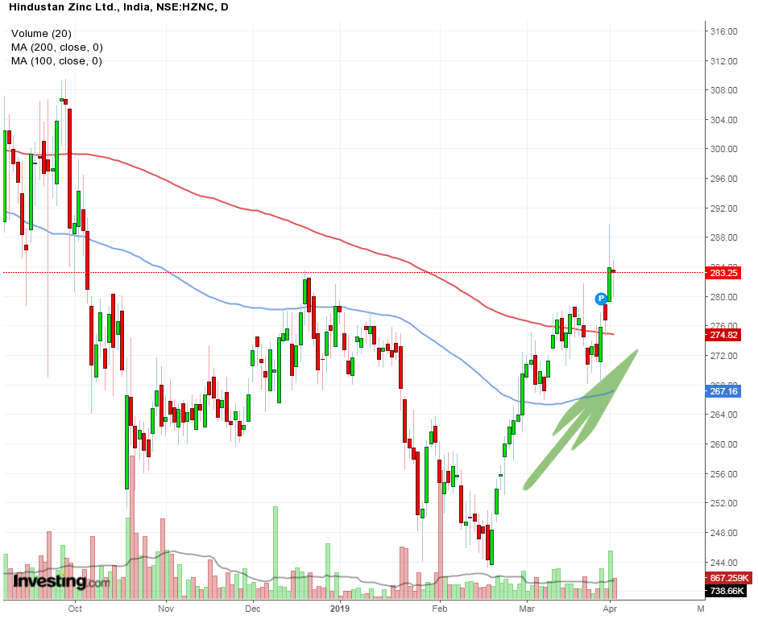
We can see from the daily chart of Hindustan Zinc Ltd. below that the stock is in a strong uptrend. There is no such strong resistance to stop the continuation of the ongoing uptrend.
Since the daily chart is the preferred time frame for identifying swing trades, the weekly chart needs to be analyzed to determine if there is any resistance that the ongoing uptrend may face.
Now, from the weekly chart of Hindustan Zinc Ltd, we can see that how 100 Moving Average – an essential technical tool for traders to buy stocks is causing resistance to the ongoing uptrend. There may be chances of stock bouncing back from the resistance.
Also Read: Moving Average – an essential technical tool for traders to buy stocks
So from the weekly point of view, you can exit the trade and re-enter the trade when the stock breakouts from the resistance.
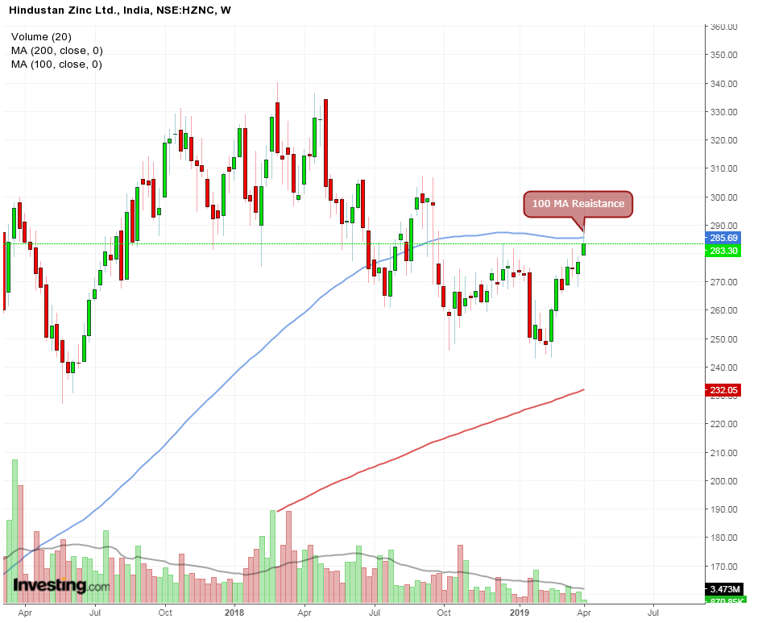
We can relate this trading example with the story that I have told above. At the daily time frame, we didn’t see any resistance that might end the uptrend but when we zoomed out and saw a larger time frame, we noticed how the stock was facing resistance.
Also Read: A complete overview on trend and theory of retracement
Just like we saw that the climate was beautiful currently but 8 hours later there was a chance of thunderstorms coming.
Entry Principle for Multi Time Frame Analysis:
Here are a few entry principles for this strategy:
- One should define what their “signal” chart is. For swing traders, this will be a Daily chart and for Day traders, it will be a smaller timeframe like 2/5/10/15 minutes chart
- One should add a higher time frame chart that is either than your signal chart.
- One should trade their signal chart as before, but also remember to trade in the direction of the swings on that higher timeframe chart.
Benefits of Multi Time Frame Trading Analysis
The following are the benefits of using Multi Time frame analysis for trading:
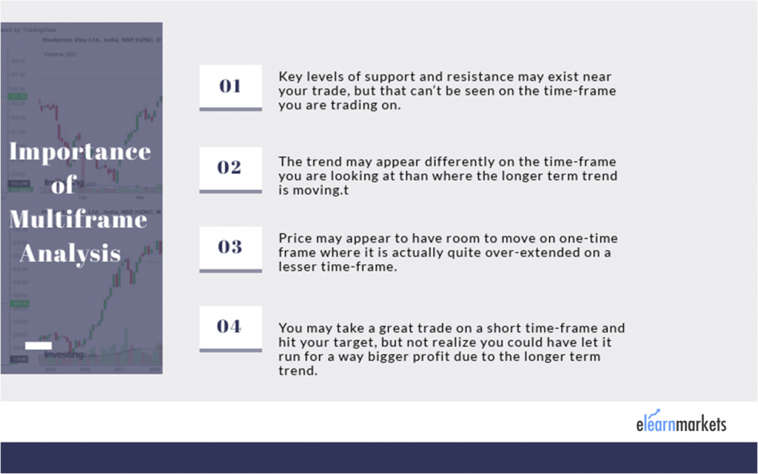
- The trend may appear differently on the time frame which you are looking at than the longer-term trend.
- Key levels of support and resistance may be there near your trade, but this cannot be seen on the time frame on which you are trading.
- You may have taken a great trade on a shorter time frame and achieve your target but did not realize that if you have taken a longer time frame then you might have earned more profit.
- You can make precise entry points shorter time frames than longer time frames.
Key Takeaways:
- One should take Multi Time Frame analysis to identify trading opportunities.
- A higher multi time frame trading is used to find the overall market direction and a lower time frame is used to find an entry for the trade
- The multi time frame analysis can be used for counter-trend trading.
- Using multi time frame analysis helps in combining the benefits of reliability of a higher time frame and also reduces the risk of a lower time frame.
Did you find the multi-timeframe analysis strategy interesting? Let us know by commenting below what you think about this trading strategy.
Happy Learning!


I really appreciate this post. I¦ve been looking everywhere for this! Thank goodness I found it on Bing. You’ve made my day! Thank you again
Content of Multi time frame is good. Looking forward for more on this topic.
i was confuse all about multitime frame analisys this blog is cleard all about trend thankyou
Hi,
We are glad that you liked our blog post.
Thank you for Reading!
Thanks for your support Vivekji. You had given this link on my query on E-Learn Ytube channel.
Hi,
Thank you for Reading!
Keep Reading