Nifty (Close 9880.2): Nifty opened gap up and faced resistance at the 20 DMA or the mid-Bollinger line (presently at 9900.3).
Nifty saw some profit booking after the initial rally and closed below 9900. Tomorrow being market expiry, it may witness high volatility.
Hourly Technical:
In the Hourly chart, Nifty is standing very close to the higher edge of the symmetrical triangle.
There is a possibility that it may see some consolidation in the coming days.
Moreover, 200 Hourly moving average is a strong resistance for Nifty which acted as a strong resistance in the last attempt.
On the upside, Nifty may face resistance at 200 Hourly moving average (presently at approx. 9927.3) and upper Bollinger line (presently at approx. 9943.2).
The probable support in the hourly chart comes at 13 Hour moving average (presently at approx. 9854) and 50 Hour moving average (presently at approx. 9841).
Hourly CCI and RSI are in the neutral zone while Stochastic is still in the overbought zone.
However, the declining ADX indicates lack of upside momentum.
Learn Technical analysis from scratch by enrolling in NSE Academy Certified Technical Analysis course on Elearnmarkets.
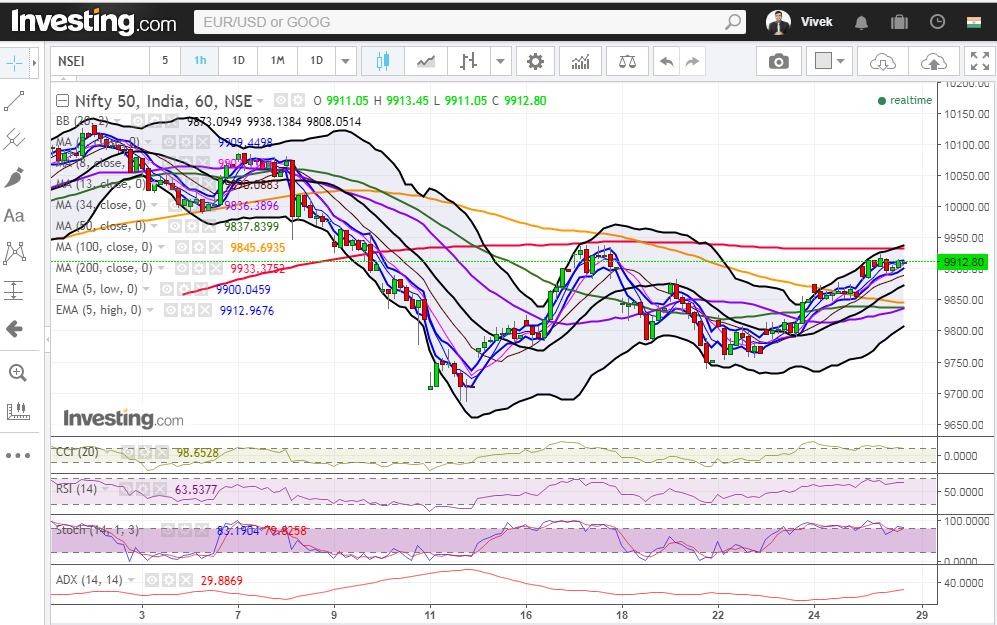
Figure: Hourly Chart
Daily Technical:
In daily chart, Nifty is neutral to bearish.
The mid-Bollinger line acted as a strong resistance and this was the third time, Nifty closed below this level.
The probable support in the daily chart comes at 5 DMA (presently at approx.9860) and 50 DMA (presently at approx.9820).
The probable resistance comes at 20 DMA (presently at approx. 9900) and 34 DMA (presently at approx. 9915).
The daily RSI, CCI and stochastic are in the neutral zone. However, the declining ADX indicates lack of momentum.
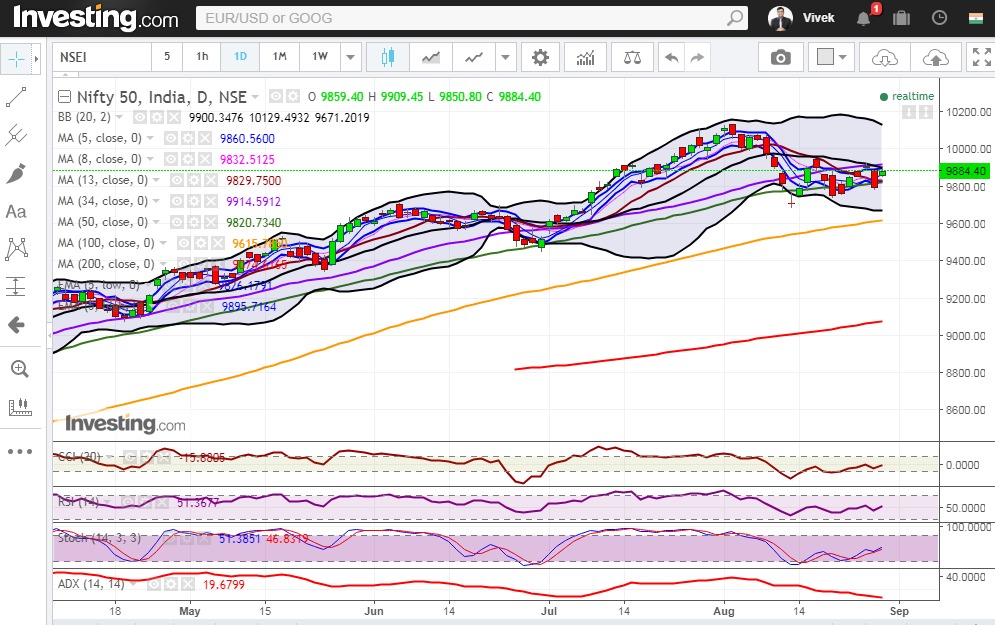
Figure: Daily Chart
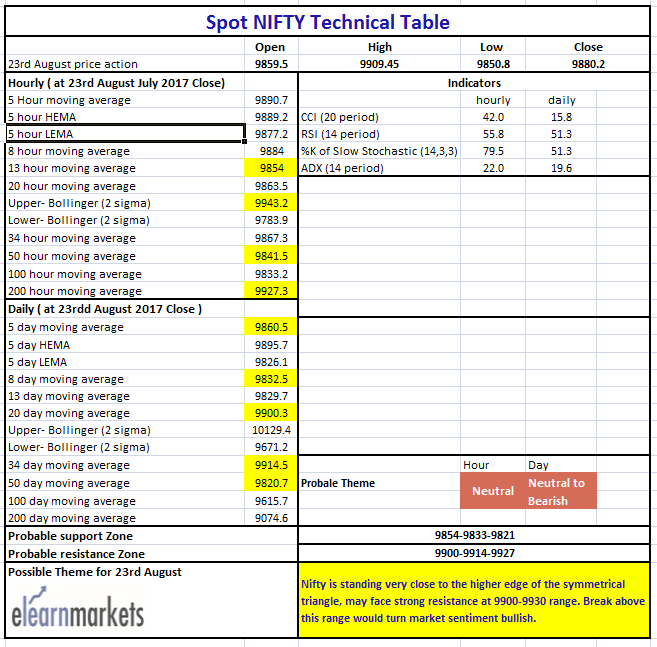
Figure: Tech Table
Watch the below video to know how to interpret the above table:


