
Nifty (Close approx. 9837.4): Nifty opened gap up on Monday and continued its up-move on Wednesday. However, from Thursday 2nd half it started drifting downward from the trend line resistance (shown in hourly chart) and closed the week with approx. 127 points of gain
Hourly Technical:
Nifty opened gap down in Friday’s session after facing strong resistance at 200-hour moving average during Thursday.
As mentioned in last day’s report’s tech table, that the range (9863-9960) breakout in either direction will change the momentum. Accordingly today the open (At approx. 9866) below the above-mentioned level of 9863 led to further sharp decline.
The probable support in the hourly chart comes at lower Bollinger line (presently at approx. 9792.2) and 9712, which is 61.8% retracement level of the down move from approx. 10137.9 to approx.9448.8. The probable resistance in the hourly chart could be seen at 20 hours moving average (presently at approx. 9875.6) and 13-hour moving average (presently at approx.9863.2).
The hourly CCI and stochastic have just come out from the oversold zone and entered the neutral zone along with the hourly RSI. Moreover, the hourly ADX has again started to move on the upside indicating a gain in downside momentum. Nifty in the hourly chart remains neutral to bearish.
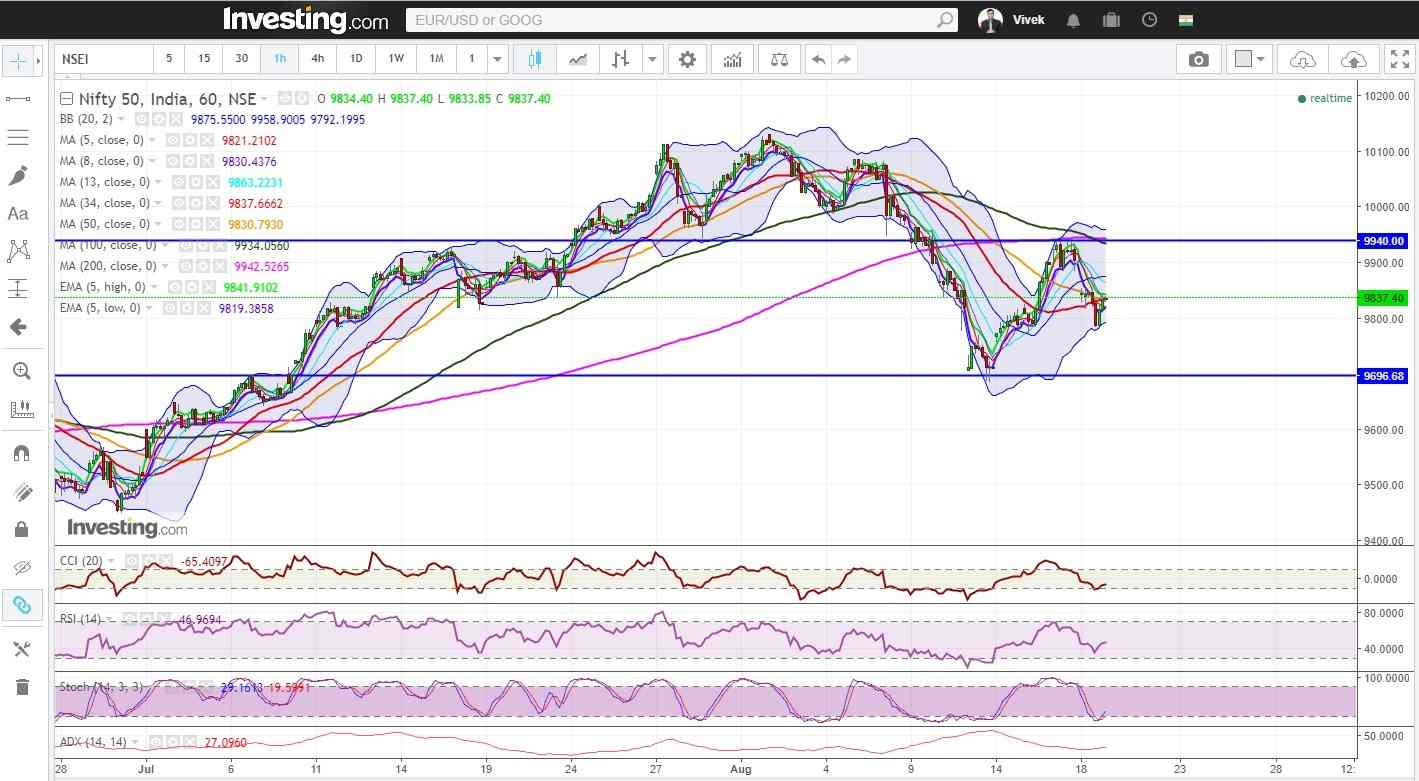
Figure: Hourly Chart
Daily Technical:
In the daily chart, Nifty took support from the important 50 DMA which is a very crucial level to watch out for. However, break below this 50 DMA may disturb the current uptrend.
The next probable support in the daily chart remains at 50 days moving average (presently at approx. 9790.7) and 78.6% retracement level of the up move from approx. 9947.8 to approx. 9686.6(presently at approx. 9742.5).
On the upside, the probable resistance could be 20 DMA (presently at approx. 9958.2) and 5 days High EMA (presently at approx. 9892.1).
The Daily CCI, RSI and slow stochastic are in the neutral zone close to lower bound of the oversold area. The daily ADX is still neutral. Overall Nifty in the daily time frame remains bearish to neutral.
Become a Technical Analysis Expert by joining: NSE Academy Certified Technical Analysis course on Elearnmarkets.
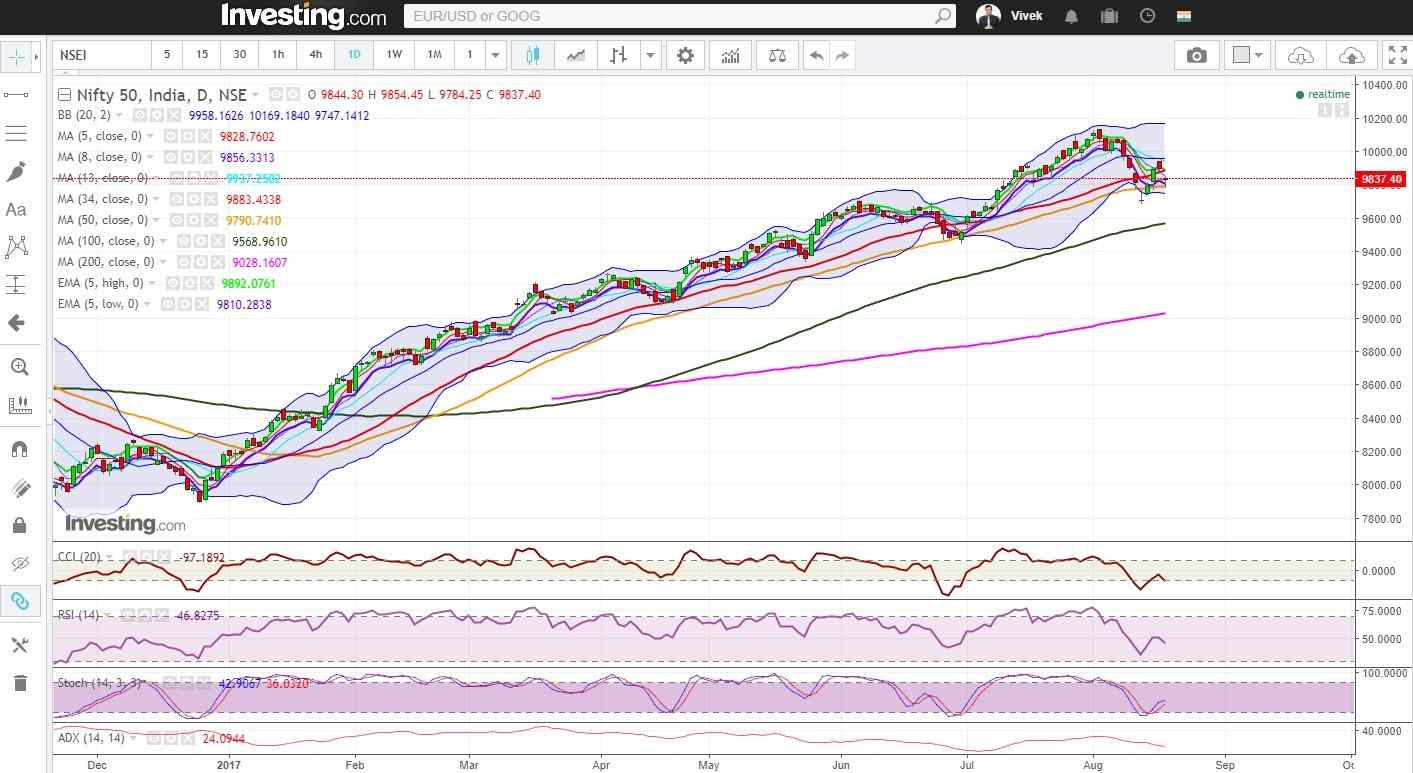
Figure: Daily Chart
Weekly Technical
In the weekly chart, the overall bearish view due to the presence of long red candle last week is partially negated. The close above 5 week low EMA (presently at approx. 9768) and market taking support from that level is a sign of strength in the weekly chart.
Weekly CCI, RSI, slow stochastic have just entered the normal zone from overbought zone while weekly ADX looks like topping out. Overall, Nifty remains neutral in the weekly timeframe.
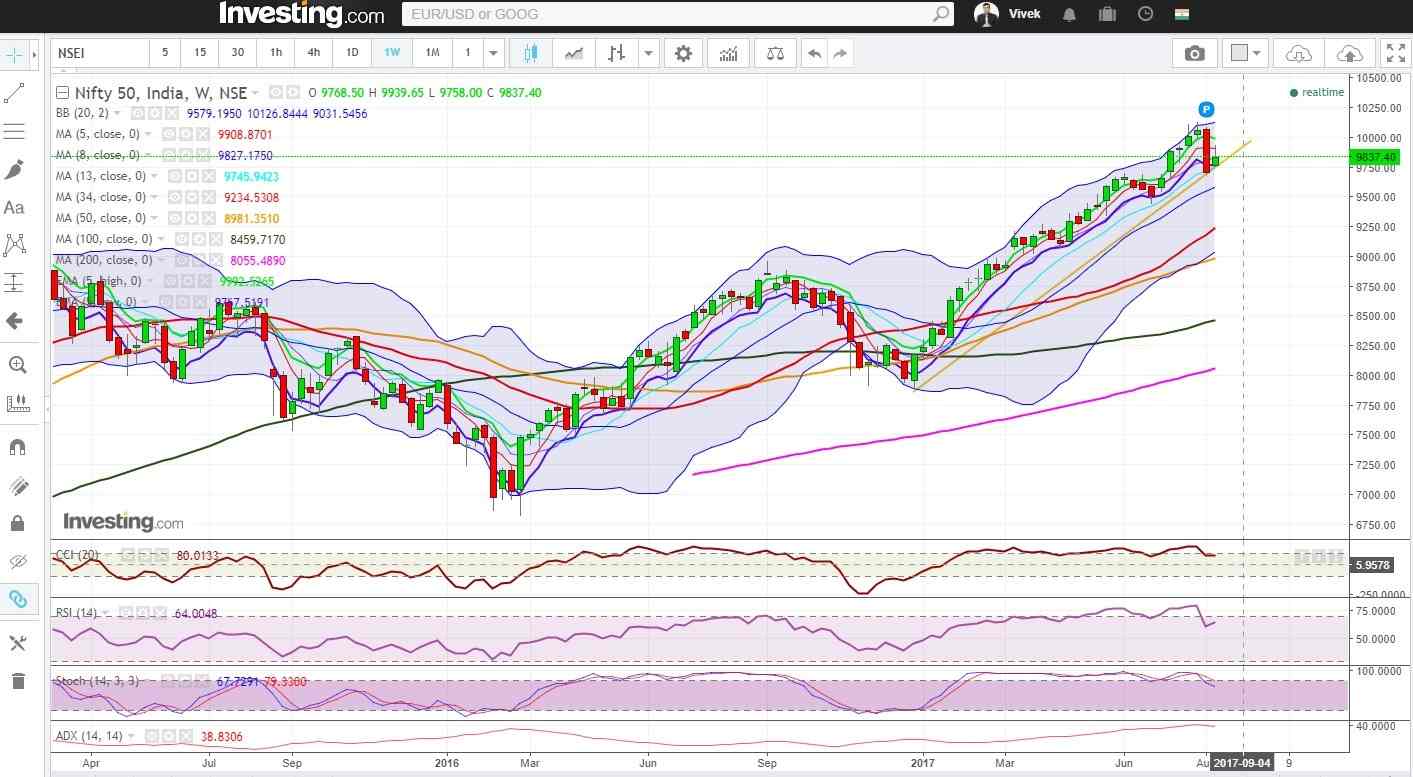
Figure: Weekly Chart
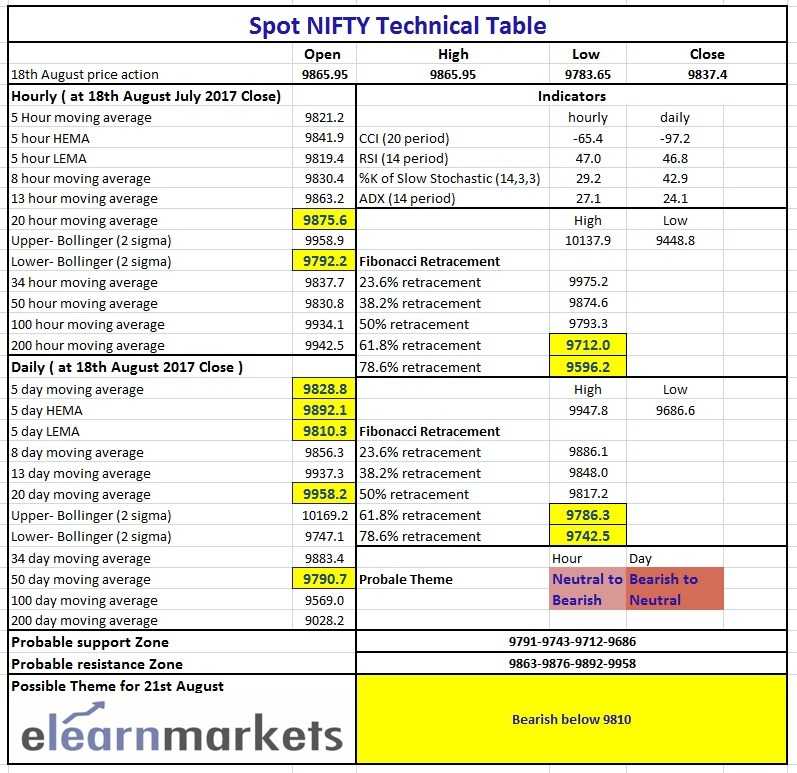
Figure: Tech Table
Bank Nifty (close approx. 24074.45): Bank Nifty opened with a gap up on Monday and moved up on 16th August, but the gain was given up in next two trading days. Overall, it closed flat for the week.
Hourly technical:
In the hourly chart, Bank Nifty has closed below most short-term moving averages. On the upside, the 34 and 50-hour moving averages (presently in the 24160-24170 zone) are likely to act as resistance. Bank Nifty has to cross 100 hours moving average (presently at approx. 24490) to turn bullish.
Hourly CCI, RSI and slow stochastic are close to the bottom of their respective normal range and are flattening out. The hourly ADX is also indicating lack of momentum. Overall, Bank Nifty is neutral in hourly timeframe.
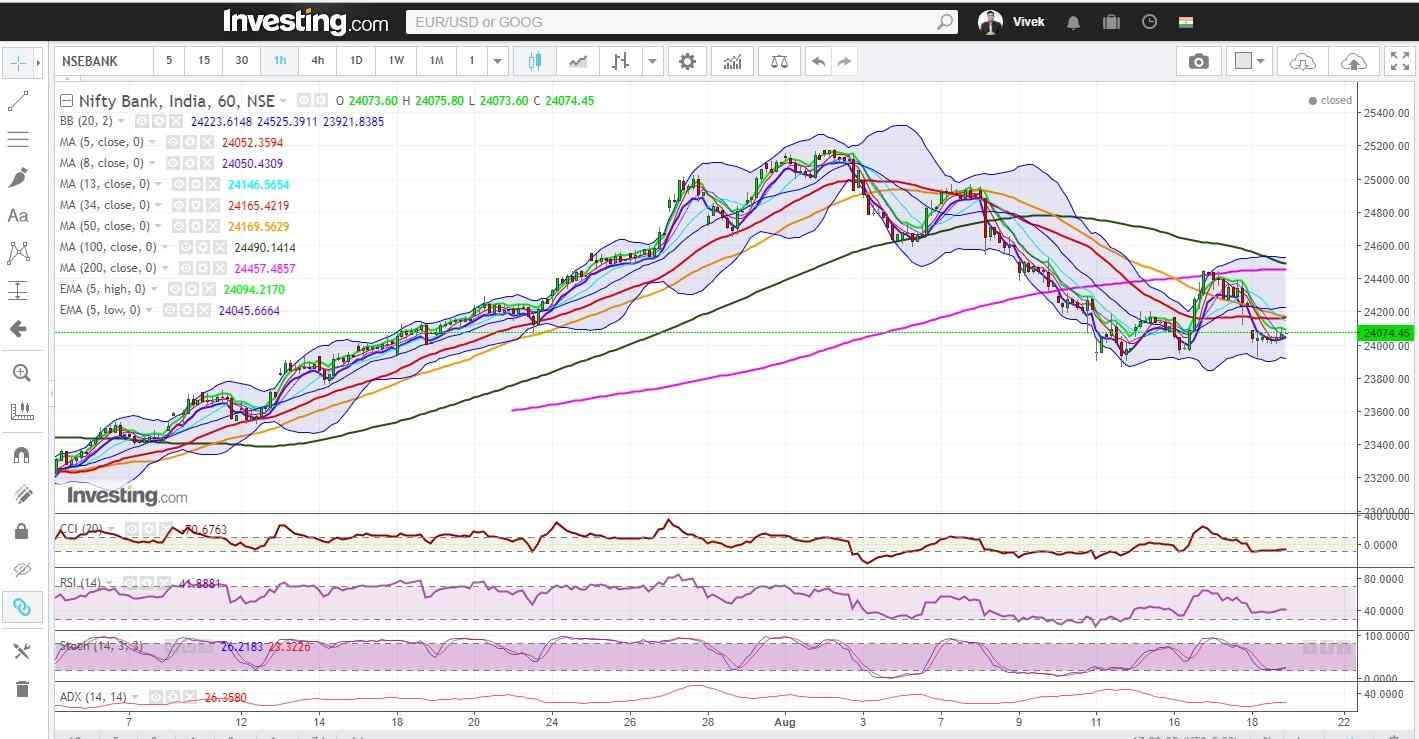
Figure: Hourly Chart
Daily technical:
Bank Nifty is just above its 50 DMA, which is now the make or break level for Bank Nifty in the daily time frame. If it violates the 50 DMA substantially, the 8-month-old uptrend gets broken for the time being. On the other hand, The Bank Nifty may choose to resume its uptrend from these levels. Bank Nifty has to move above 20 DMA (presently approx 24567) to resume its uptrend.
Hourly CCI, RSI and slow stochastic indicates bearish to neutral view. The daily ADX is completely at the bottom. This can be an important juncture as Bank Nifty may unfold decisive move in either direction.
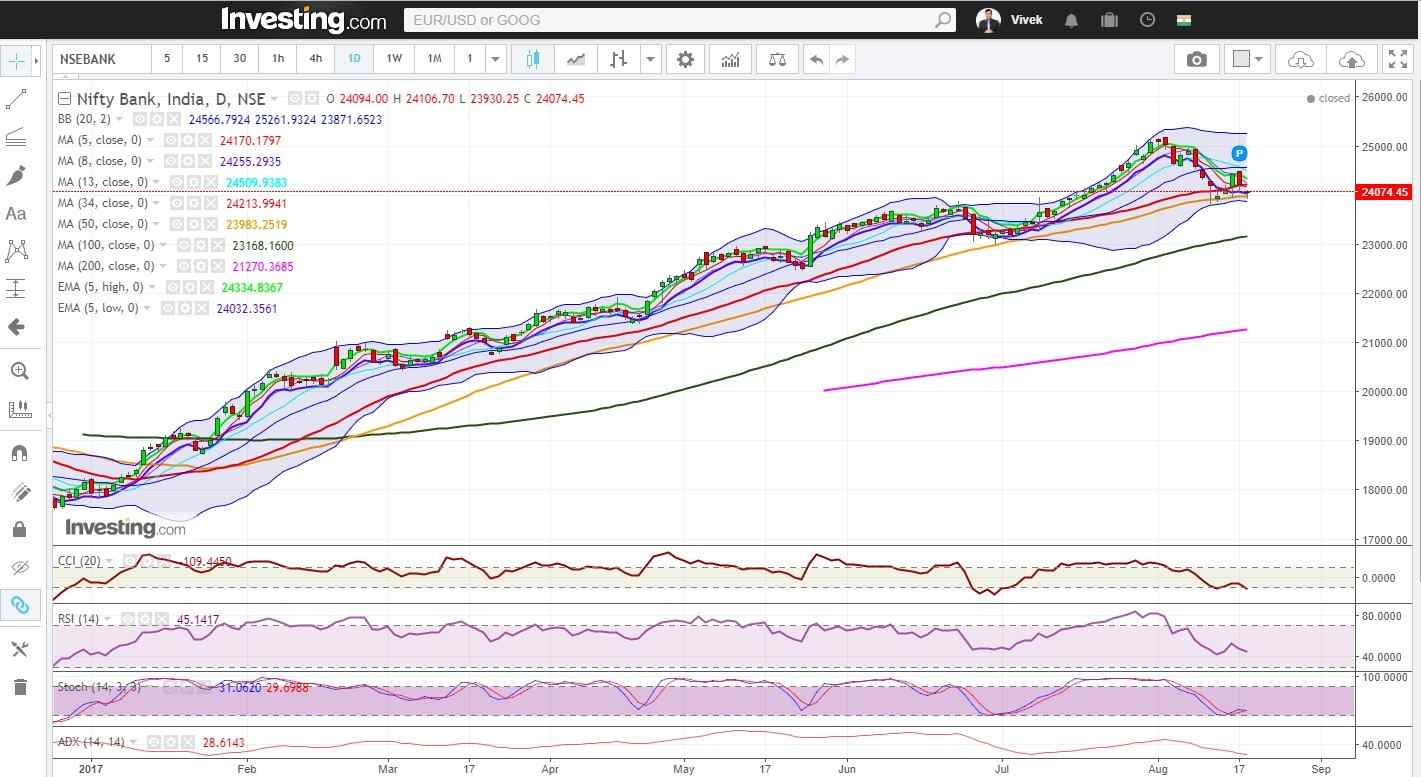
Figure: Daily Chart
Weekly Technical:
In weekly chart, Bank Nifty looks topping out for now. The big red candle of last week was followed up with a small Doji. However, weekly close above 5 weeks low ema (presently at 23932 approx.), slightly arrests the bearish sentiment as of now.
Weekly CCI, RSI, slow stochastic have just entered the normal zone from overbought zone while weekly ADX looks like topping out. Overall, Bank Nifty is still neutral in the weekly time frame. However, a decisive move below 13 weeks moving average (presently at 23848) is likely to trigger a further correction.
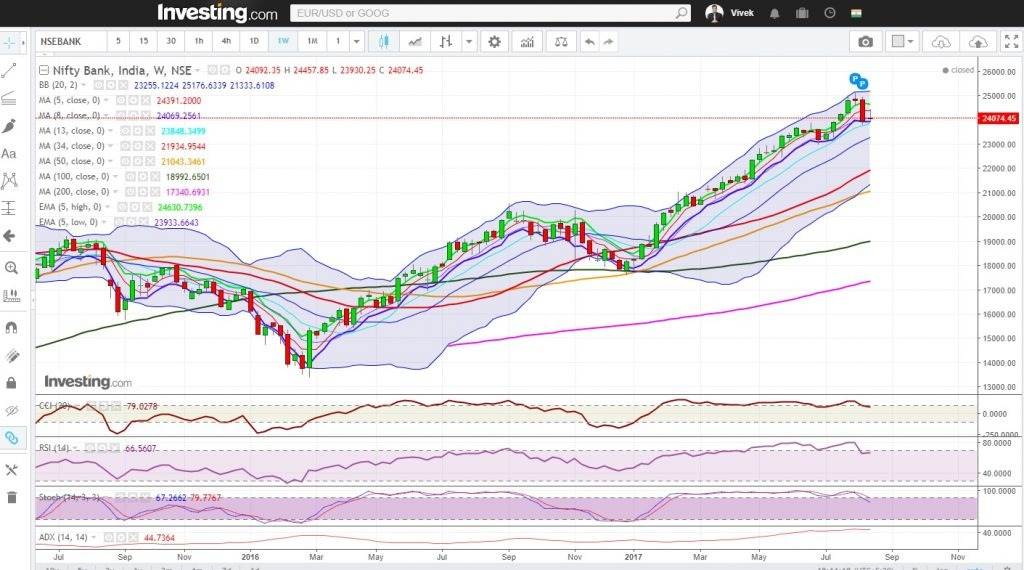
Figure: Weekly Chart
Want to know how to interpret the below Technical Table?Watch the video below:
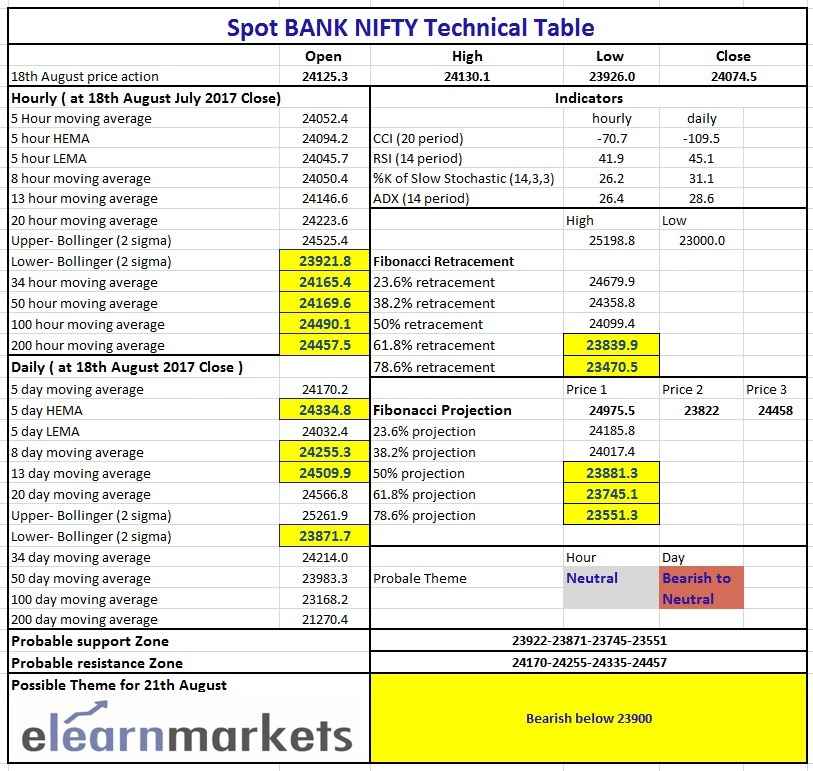
Figure: Tech Table
Bottomline
You can read related blogs here.
To watch videos on financial markets and other financial topics visit our youtube channel.
Happy Learning!!


