Elearnmarkets - Financial Market Learning
  • Categories
    • Basic Finance
    • Derivatives
    • Financial Planning
    • Fundamental Analysis
    • Technical Analysis
    • Marketshala
    • Miscellaneous
  • Language
    • English
    • Hindi
    • Bengali
No Result
View All Result
  • Courses
  • Webinars
  • Go To Site
  • Login
Elearnmarkets
  • Categories
    • Basic Finance
    • Derivatives
    • Financial Planning
    • Fundamental Analysis
    • Technical Analysis
    • Marketshala
    • Miscellaneous
  • Language
    • English
    • Hindi
    • Bengali
No Result
View All Result
Webinars
Elearnmarkets - Learn Stock Market, trading, investing for Free
No Result
View All Result
Home Technical Analysis Market Analysis
30th April Nifty Hourly chart

Nifty Breaks Out Of Short Term Resistance On Positive Global Cues

Elearnmarkets by Elearnmarkets
November 18, 2020
in Market Analysis, Market Wrap
Reading Time: 2 mins read
2
34
VIEWS
Share on FacebookShare on TwitterShare on WhatsApp

Nifty close 10692.3: Nifty came out of short term resistance of 10600 with a gap up on positive global cues and earnings optimism. Moreover there is a gap filling opportunity in the index and given the positive momentum, it seems that Nifty may soon cross 10760 in the near term.
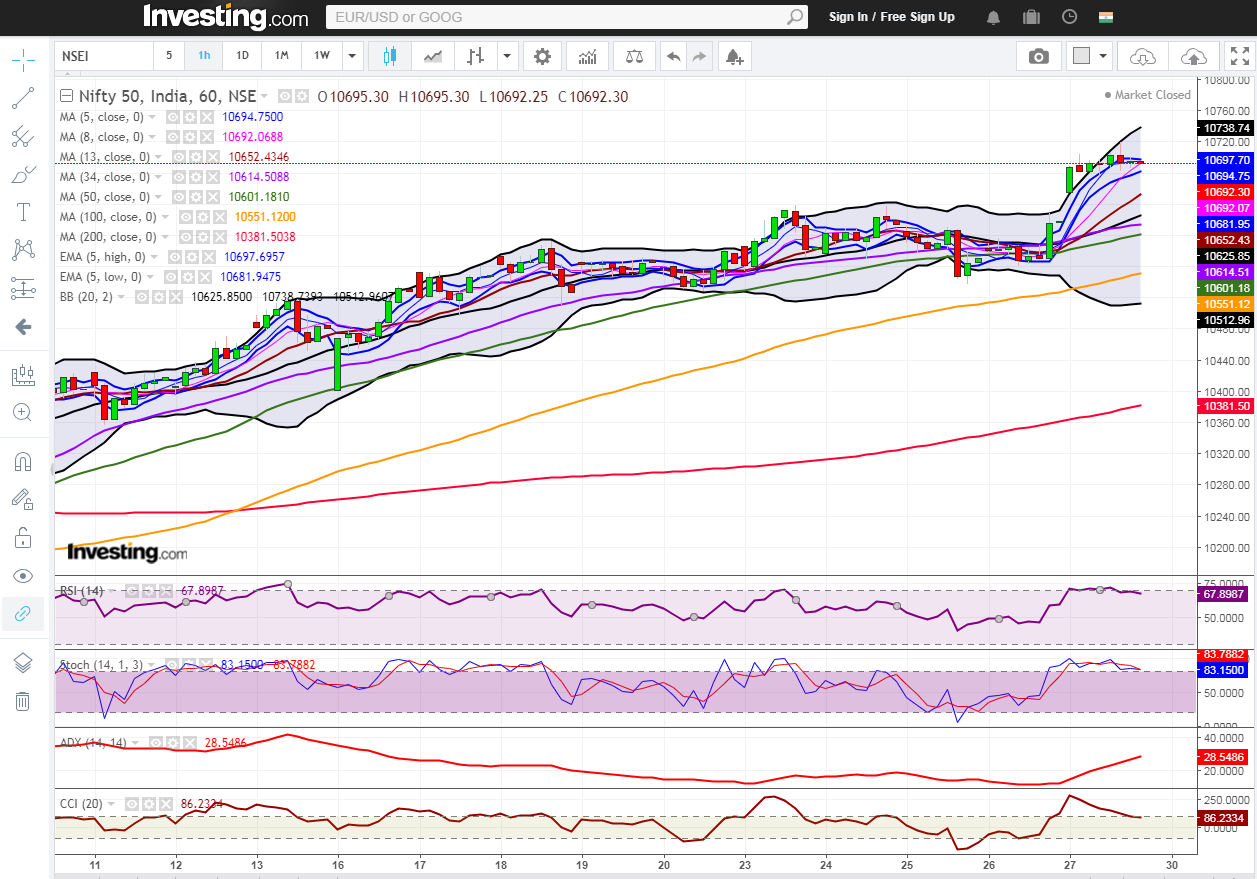
Hourly Technical

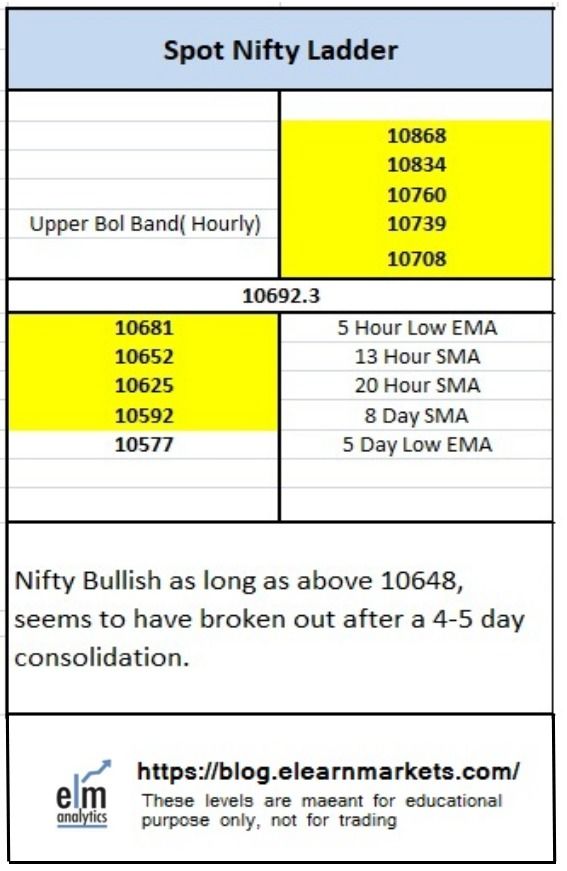
In the hourly chart, Nifty is trading above most short term moving averages. The probable support in the hourly chart comes at 13 Hour SMA (presently at approx. 10652) and 20 Hour SMA (presently at approx. 10625).

On the upside, Nifty may face resistance at upper Bollinger band (presently at approx. 10739).Hourly Stochastic is in the overbought zone while RSI and CCI are trading close to the upper bound of their respective range suggesting strength in the hourly time frame. Overall, Nifty appears strong in the Hourly chart.
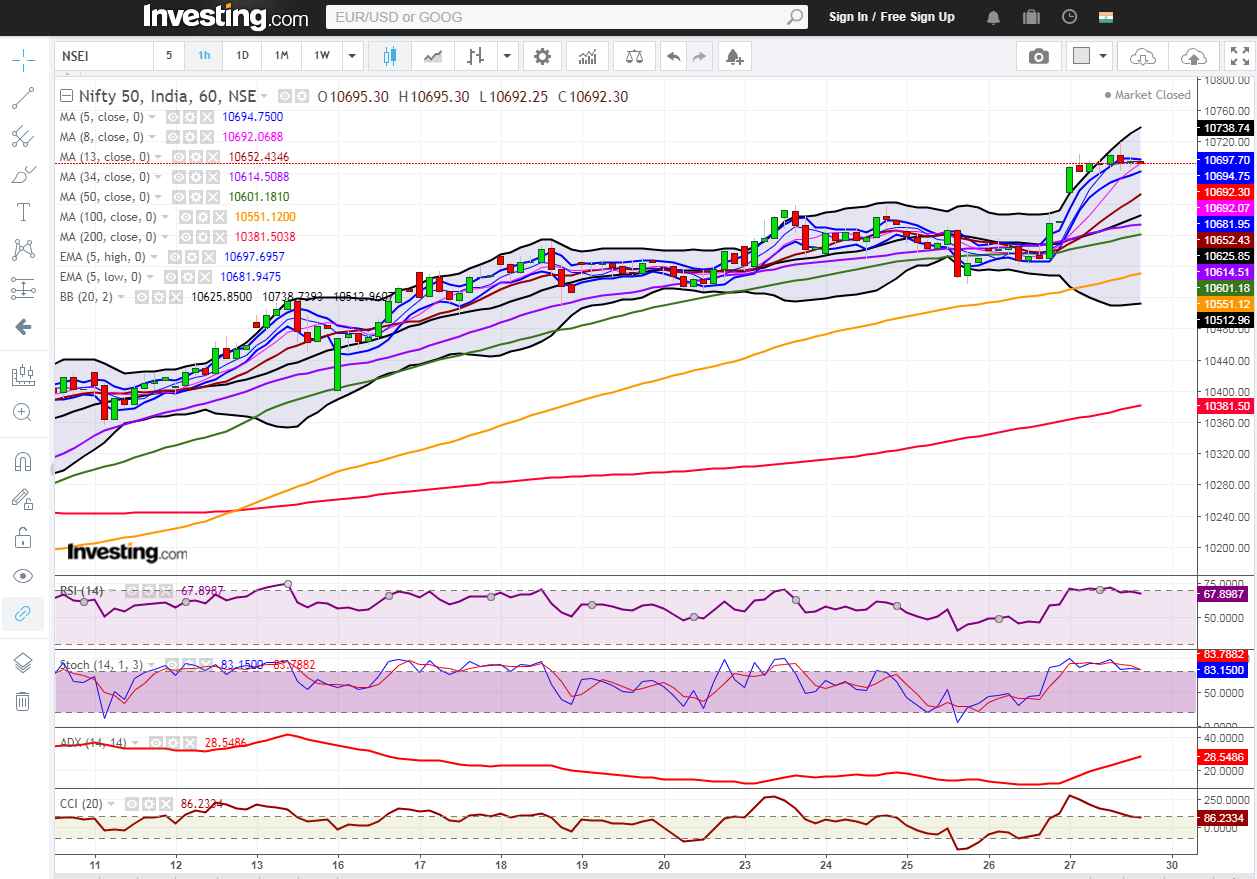
30th April Nifty Hourly chart
Hourly chart
Daily Technical

In the daily chart, Nifty is trading above 5 day High EMA and also above most moving average suggesting upside momentum. Moreover, Nifty broke out of the congestion area of 10600 with good volume suggesting positive outlook in the daily chart.

The probable support in the daily chart comes at 8 Day SMA (presently at approx. 10592) and 5 Day Low EMA (presently at approx. 10577).

On the upside, Nifty may face resistance at upper Bollinger band (presently at approx. 10754). Daily RSI is trading close to the upper bound while Stochastic and CCI are very close to the upper bound of their respective range suggesting strength in the daily time frame. Overall, Nifty appears strong in the Daily chart.
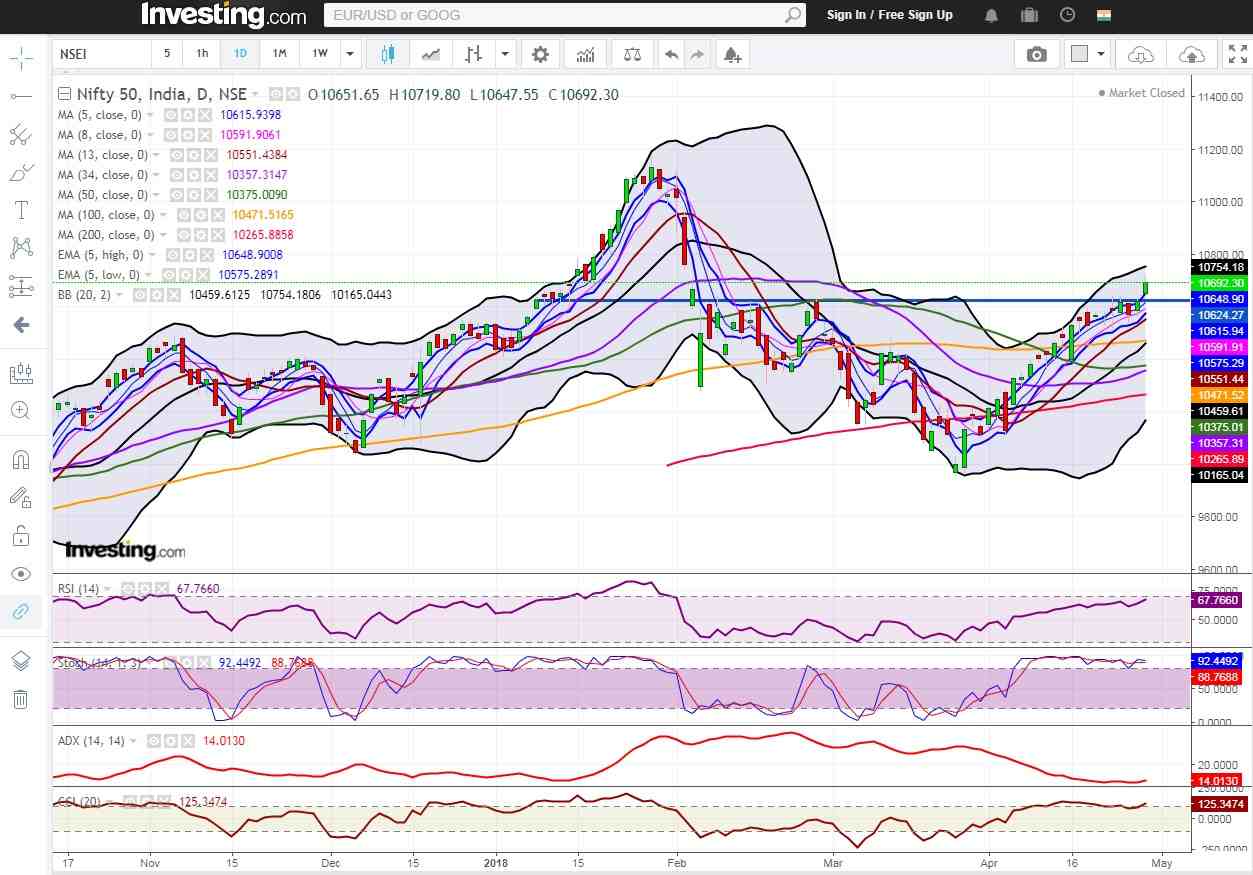
30th April Nifty Daily Chart

Daily chart
Weekly Technical

Nifty has given a positive close for the fifth consecutive week which suggests that bulls are in full control. Moreover, the close above 5 week high EMA also indicates that the upside momentum is likely to continue.

The Karnataka election which is going to take place after two weeks will play a key role in deciding the direction of Nifty going forward but as of now, the Index is expected to maintain positive bias. Weekly CCI, RSI and Stochastic are in the normal zone. Overall, Nifty remained positive to neutral in the weekly chart.
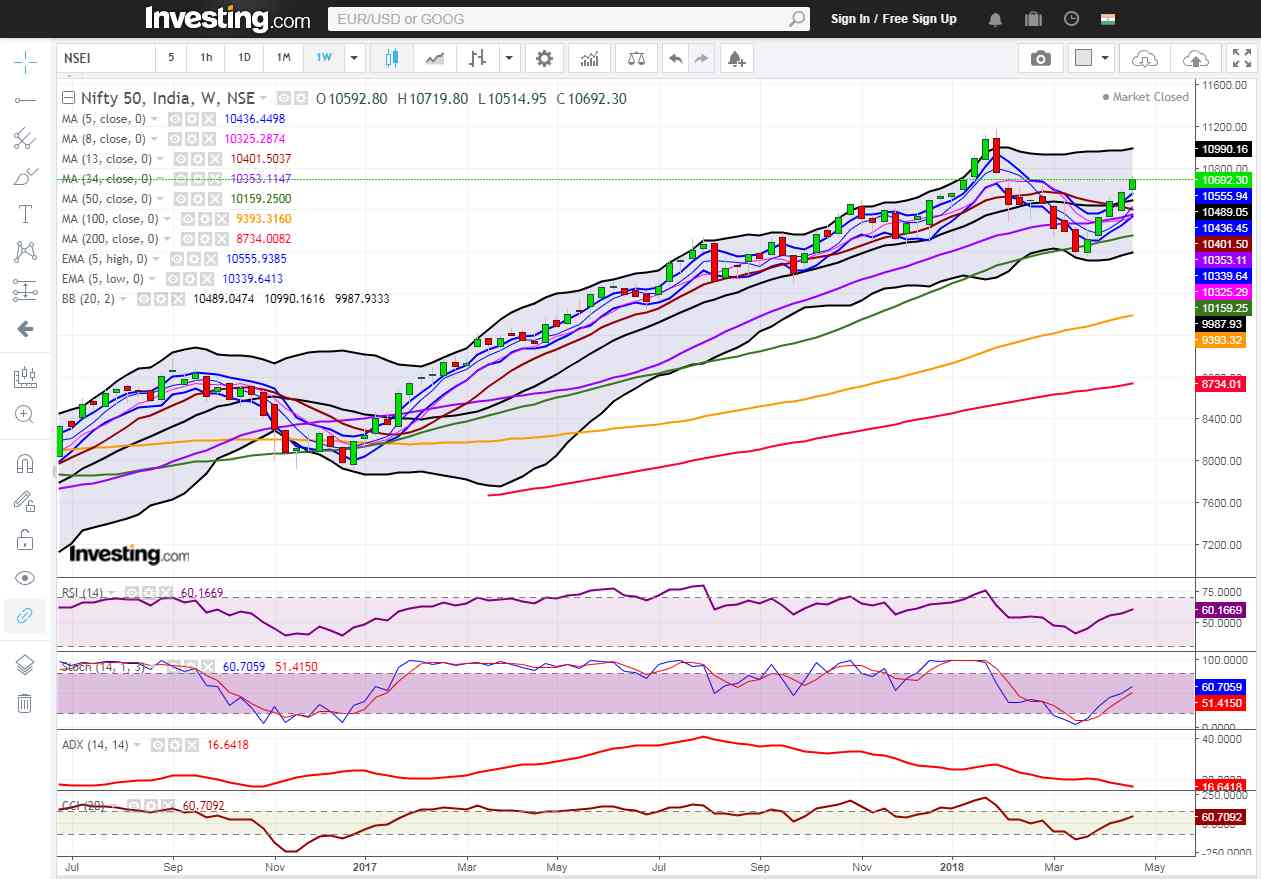
30th April Nifty Weekly Chart
Weekly chart
You can use stockedge app to get cutting edge over others in both short term trading and investing. Here you not only get data at one particular place but can also create your own combination scans based on your own technical and fundamental parameter. See the video below to know about various features in Stocedge app.

30th April Nifty ELM Matrix
Nifty ELM matrix

Tags: english
ShareTweetSend
Subscribe To Updates On Telegram Subscribe To Updates On Telegram Subscribe To Updates On Telegram
Previous Post

How to identify value stocks the Warren Buffett way?

Next Post

Mutual Fund Systematic Transfer Plan (STP) vs Lump Sum – Which option to choose?

Elearnmarkets

Elearnmarkets

Elearnmarkets (ELM) is a complete financial market portal where the market experts have taken the onus to spread financial education. ELM constantly experiments with new education methodologies and technologies to make financial education effective, affordable and accessible to all. You can connect with us on Twitter @elearnmarkets.

Related Posts

Hourly Chart
Market Analysis

Nifty Ends on Positive Note, Gains Approx. 475 Points on Positive Global Factors

November 18, 2020
360
Weekly Chart
Market Analysis

Huge Sell-Off Makes the Market Close in a Negative Note on the Expiry Week

November 18, 2020
157
Hourly Chart
Market Analysis

Nifty Ends in Green. Rupee Appreciates and Falling Crude Price Helped the Market to Recover Approx. 140 Point

November 18, 2020
121
Hourly Chart
Market Analysis

Sell Off Continues. Nifty Ends The Week With Three Consecutive Red Candles

November 18, 2020
129

Comments 2

  1. kazu says:
    4 years ago

    Thank you for this post. Its very inspiring.

    Reply
    • Tista Sengupta says:
      4 years ago

      Welcome

      Reply

Leave a Reply Cancel reply

Your email address will not be published. Required fields are marked *

Follow Us

Facebook-f Twitter Instagram Linkedin-in Youtube Telegram

Download App

Register on Elearnmarkets

Continue your financial learning by creating your own account on Elearnmarkets.com

Register Free Account

Get Articles On Email

Enter your email address:

Categories

  • Basic Finance
  • Derivatives
  • Financial Planning
  • Fundamental Analysis
  • Technical Analysis
  • Marketshala
  • Miscellaneous

© 2022 Elearnmarkets . All Rights Reserved

  • Visit Elearnmarkets
  • Courses
  • Webinars
  • Financial Guides
  • Get Free Counselling

Get Elearnmarkets App

No Result
View All Result
  • Article Categories
    • Basic Finance
    • Derivatives
    • Financial Planning
    • Fundamental Analysis
    • Technical Analysis
    • Marketshala
    • Miscellaneous
  • Language
    • Hindi
    • Bengali
    • English
  • Courses
  • Webinars

© 2020 Elearnmarkets All Rights Reserved

Welcome Back!

Login to your account below

Forgotten Password?

Retrieve your password

Please enter your username or email address to reset your password.

Log In

Suggested Learning

Technical Analysis Made Easy

Certification in Online Technical Analysis

Online NSE Academy Certified Capital Market Professional (E-NCCMP)

ELM School

LOVING OUR BLOGS?

Explore more content for free at ELM School.

Start reading & learning from various text-based modules covering all aspects of finance from today!

VISIT ELM SCHOOL