Elearnmarkets - Financial Market Learning
  • Categories
    • Basic Finance
    • Derivatives
    • Financial Planning
    • Fundamental Analysis
    • Technical Analysis
    • Marketshala
    • Miscellaneous
  • Language
    • English
    • Hindi
    • Bengali
No Result
View All Result
  • Courses
  • Webinars
  • Go To Site
  • Login
Elearnmarkets
  • Categories
    • Basic Finance
    • Derivatives
    • Financial Planning
    • Fundamental Analysis
    • Technical Analysis
    • Marketshala
    • Miscellaneous
  • Language
    • English
    • Hindi
    • Bengali
No Result
View All Result
Webinars
Elearnmarkets - Learn Stock Market, trading, investing for Free
No Result
View All Result
Home Miscellaneous
Nifty Hourly Chart

Nifty Broke Down From Head & Shoulder Pattern And Ended On A Weaker Note

Elearnmarkets by Elearnmarkets
November 18, 2020
in Miscellaneous
Reading Time: 2 mins read
0
366
VIEWS
Share on FacebookShare on TwitterShare on WhatsApp

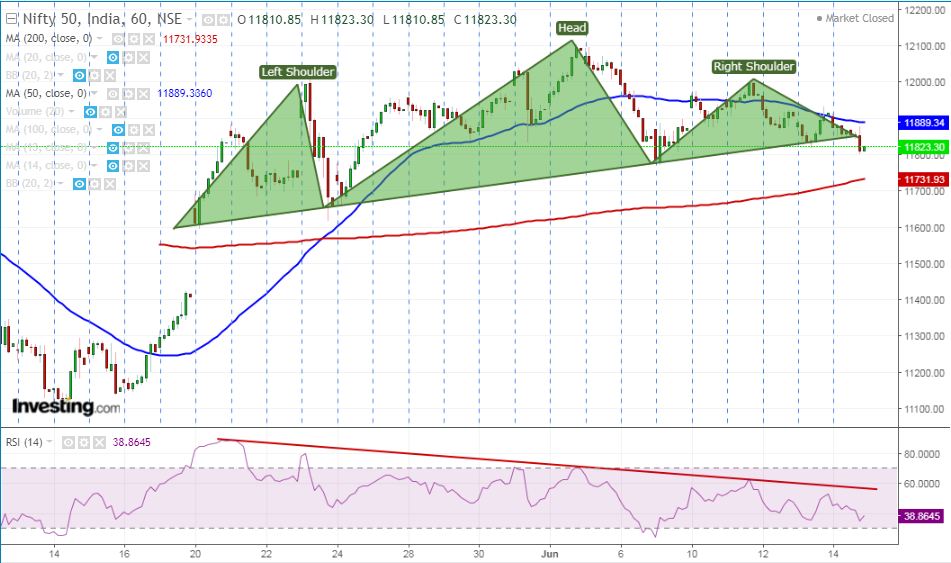
Nifty after trading range bound extended weakness in the late trade on Friday’s session after the news that India may impose retaliatory tariffs on 29 US products. At the same time, the index closed below the Head & Shoulders pattern but managed to close above 11800 marks.

Hourly Technical

The index ended sharply lower in the last 30 minutes and witnessed breakdown from the neckline of Head and Shoulder pattern.

Subscribe To Webinars Subscribe To Webinars Subscribe To Webinars

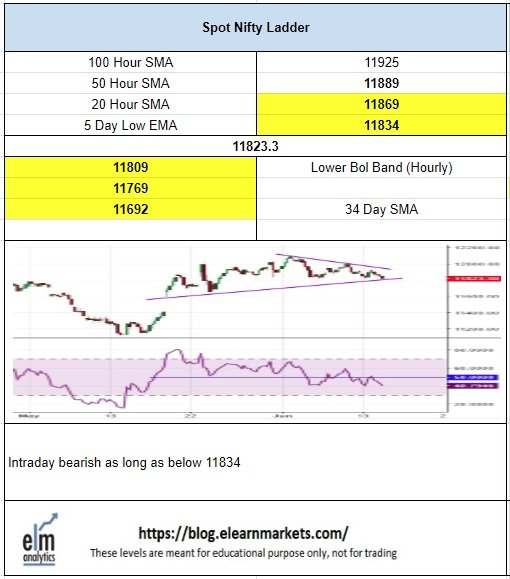
Probable support in the near term comes at 11800 and 11731 (200 period MA) and probable resistance comes at 11890 (50 period MA) and 11925 (100 period MA). Technical parameters too weak suggest weakness and most of parameters ended on a negative territory.

Nifty Hourly Chart
(Nifty Hourly Chart)

Daily Technical

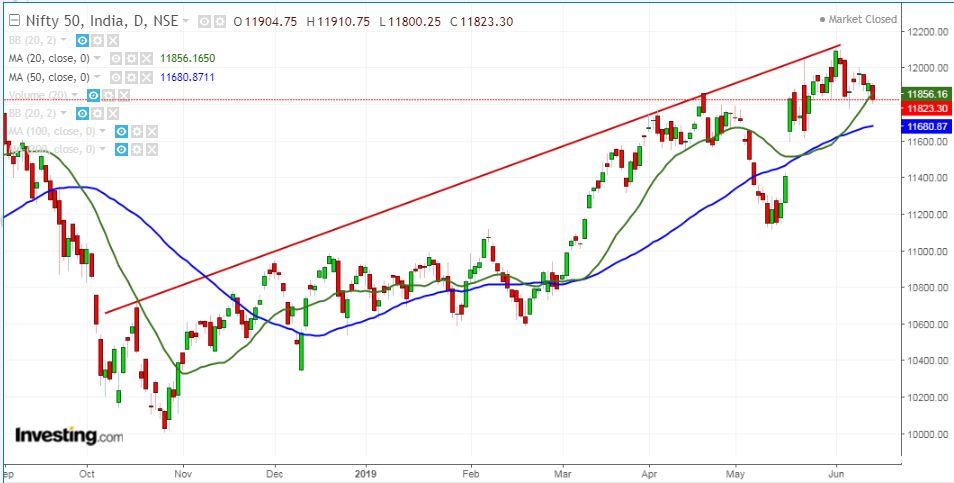
In the daily chart, Nifty closed below 20 Day SMA after a long time and gives an initial hint of weakness in the index. On the downside 11800 is a psychological level to watch out for and sustainable close below which may lead tom further weakness in the coming days.

The next important support in the daily chart comes at 11680 (50 Day SMA). Though RSI is trading just above mid 50 levels, close below which may trigger further level of weakness.

Nifty Daily Chart
(Nifty Daily Chart)

Weekly Technical

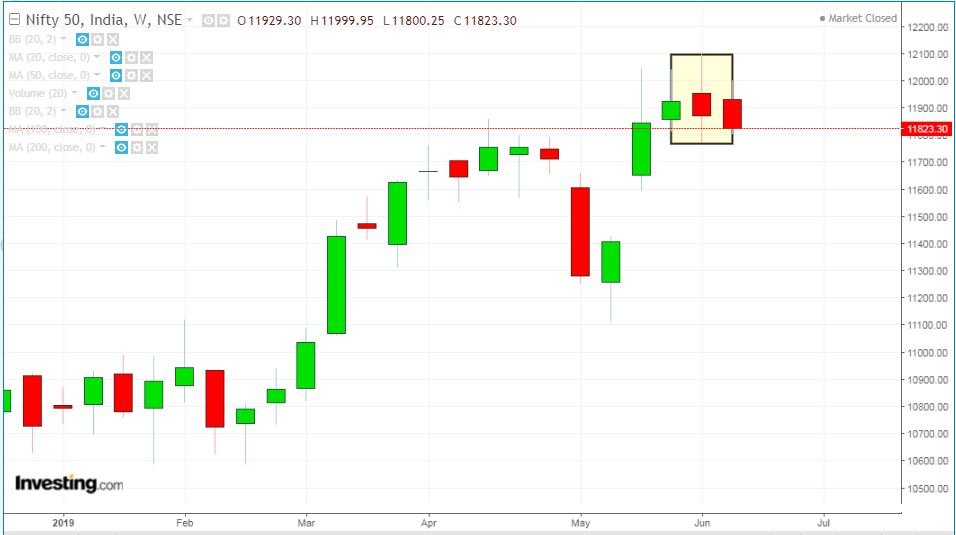
Nifty ended on a weaker note in the weekly chart after making shooting star candle last week and close below last week low at 11769 may trigger further weakness on a medium term timeframe. Probable support in the weekly chart comes at 11750, below which may see further short build up in the index.

The index has been consolidating in the range of 11800 and 12100 for last 14 trading session and break either side may infuse fresh momentum, though given the technical parameters there is a possibility to break on the downside.

Nifty Weekly Chart
(Nifty Weekly Chart)
Nifty Technical Chart
(Nifty Technical Chart)
Tags: englishhead and shoulders rulemarket reportnifty reportnifty weekly reportstock market reportstock market weekly reportweekly market reportweekly report
ShareTweetSend
Subscribe To Updates On Telegram Subscribe To Updates On Telegram Subscribe To Updates On Telegram
Previous Post

How to effectively use Fibonacci Extension to find your trading gain target?

Next Post

Is this the Right Time to invest in Small-Cap funds?

Elearnmarkets

Elearnmarkets

Elearnmarkets (ELM) is a complete financial market portal where the market experts have taken the onus to spread financial education. ELM constantly experiments with new education methodologies and technologies to make financial education effective, affordable and accessible to all. You can connect with us on Twitter @elearnmarkets.

Related Posts

Binary Options Trading
Miscellaneous

Tips for Successful Binary Options Trading

September 29, 2022
3k
Miscellaneous

5 Simple Ways to Get Into Forex Trading for Beginners

September 21, 2022
10.2k
Miscellaneous

Top 11 Factors to consider for taking a Personal Loan

August 29, 2022
1.3k
Miscellaneous

Term Plan with or Without Maturity Benefits – What’s the Difference?

September 12, 2022
305

Leave a Reply Cancel reply

Your email address will not be published. Required fields are marked *

Follow Us

Facebook-f Twitter Instagram Linkedin-in Youtube Telegram

Register on Elearnmarkets

Continue your financial learning by creating your own account on Elearnmarkets.com

Register Free Account

Download App

Categories

  • Basic Finance
  • Derivatives
  • Financial Planning
  • Fundamental Analysis
  • Technical Analysis
  • Marketshala
  • Miscellaneous

© 2022 Elearnmarkets . All Rights Reserved

  • Visit Elearnmarkets
  • Courses
  • Webinars
  • Financial Guides
  • Get Free Counselling

Get Elearnmarkets App

No Result
View All Result
  • Article Categories
    • Basic Finance
    • Derivatives
    • Financial Planning
    • Fundamental Analysis
    • Technical Analysis
    • Marketshala
    • Miscellaneous
  • Language
    • Hindi
    • Bengali
    • English
  • Courses
  • Webinars

© 2020 Elearnmarkets All Rights Reserved

Welcome Back!

Login to your account below

Forgotten Password?

Retrieve your password

Please enter your username or email address to reset your password.

Log In