Nifty close 10335.3: Nifty ended on a subdued note in today’s session after trading in a mere 40 points range. The index after opening flat in today’s session ended marginally lower by 0.27%.
Hourly Technical:
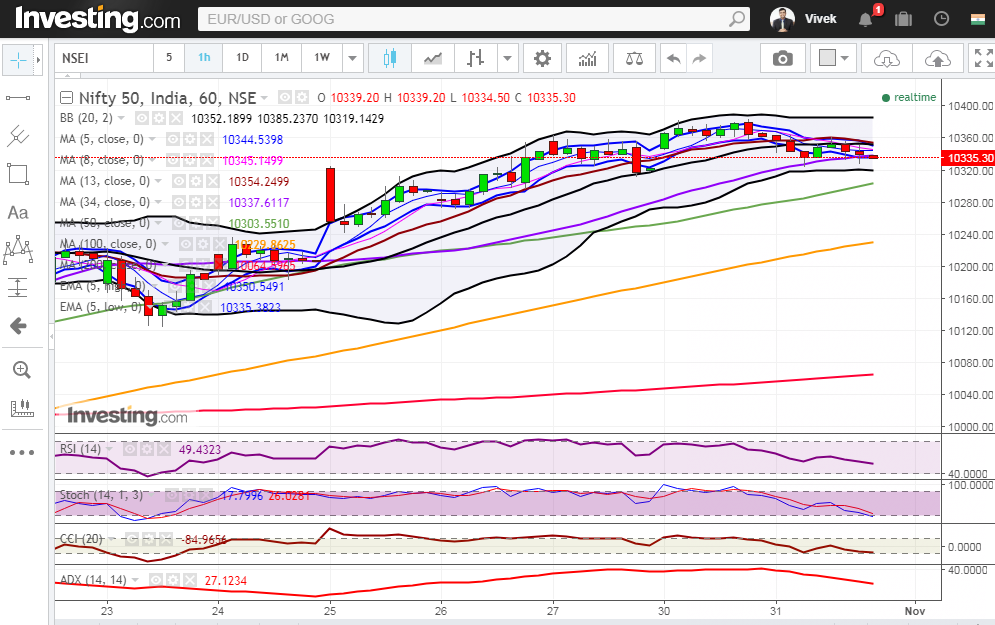
In Hourly chart, Nifty was down for most part of the day and closed marginally below 34 Hourly moving average (presently at approx.10337.6). The probable support in the hourly chart comes at 50 Hour moving average (presently at approx. 10303.6) and 100 Hour moving average (presently at approx. 10230).
On the upside, Nifty may face resistance at 5 Hour High EMA (presently at approx.10350.5) and Upper Bollinger line (presently at approx. 10385.2).
Hourly Stochastic and CCI are close to the lower bound of their respective normal zone while RSI is in the normal zone. ADX has turned down suggesting loss of momentum in the hourly chart. Overall Nifty remains neutral to bullish in the Hourly chart.
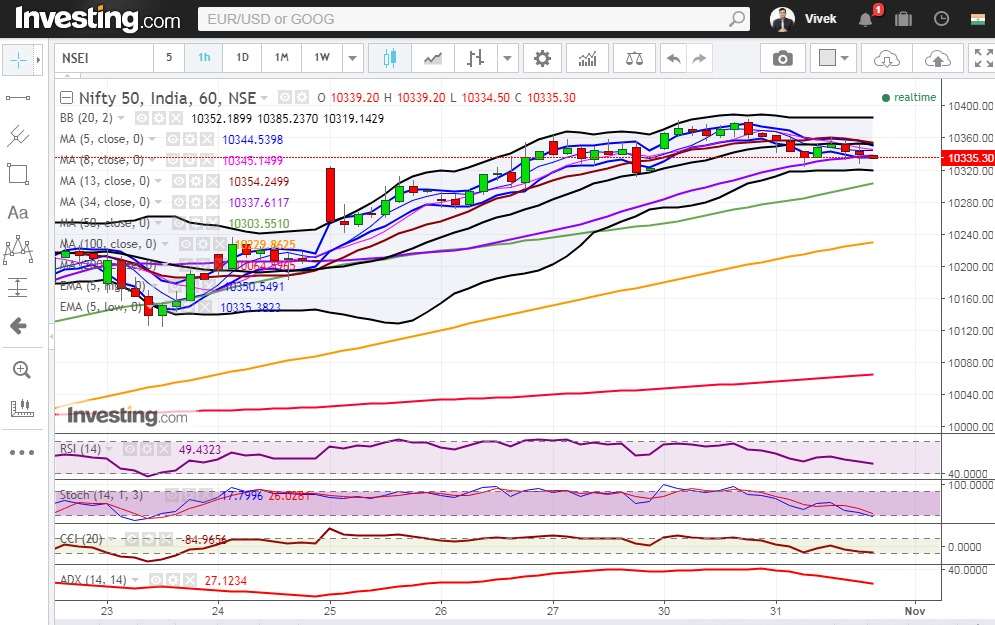
Figure: Hourly Chart
Daily Technical:
In the daily chart, Nifty has been consolidating at the top since last three trading session and today it closed below 5 Day High EMA (presently at approx. 10347.5). The probable support in the daily chart comes at 5 Day Low EMA (presently at approx. 10292.9) and 8 DMA (presently at approx. 10275).
On the upside, Nifty may face resistance at 5 Day High EMA (presently at approx.10347.5) and Upper Bollinger line (presently at approx. 140454.6).
Stochastic is still in the overbought zone while RSI and CCI are marginally below its upper bound. Overall Nifty remains bullish in the daily chart.
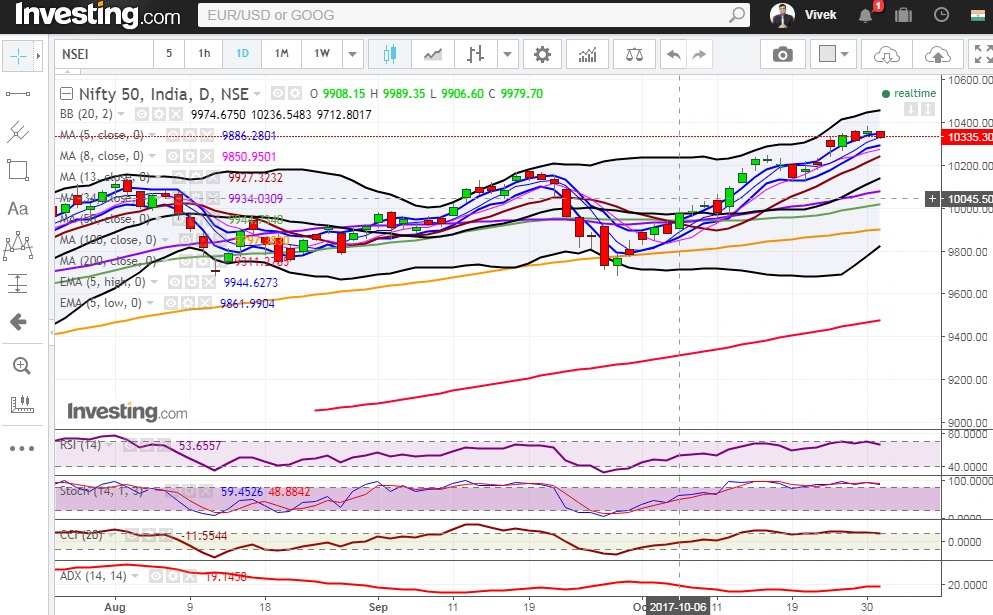
Figure: Daily Chart
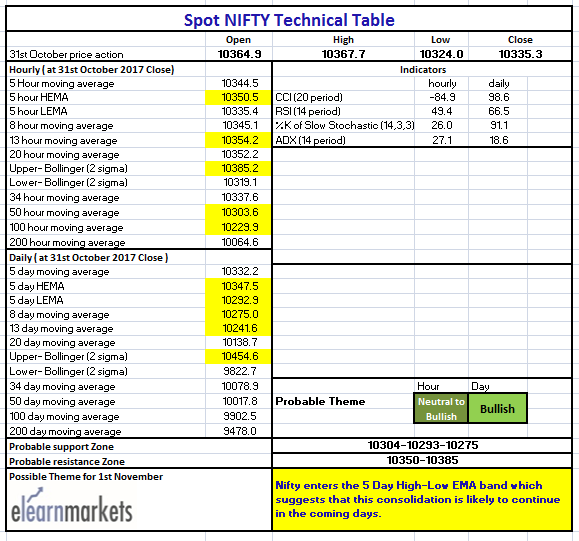
Figure: Tech Table


