Elearnmarkets - Financial Market Learning
  • Categories
    • Basic Finance
    • Derivatives
    • Financial Planning
    • Fundamental Analysis
    • Technical Analysis
    • Marketshala
    • Miscellaneous
  • Language
    • English
    • Hindi
    • Bengali
No Result
View All Result
  • Courses
  • Webinars
  • Go To Site
  • Login
Elearnmarkets
  • Categories
    • Basic Finance
    • Derivatives
    • Financial Planning
    • Fundamental Analysis
    • Technical Analysis
    • Marketshala
    • Miscellaneous
  • Language
    • English
    • Hindi
    • Bengali
No Result
View All Result
Webinars
Elearnmarkets - Learn Stock Market, trading, investing for Free
No Result
View All Result
Home Technical Analysis Market Analysis
Nifty Hourly Chart

Nifty Consolidates Below 200 Hourly Moving Average

Elearnmarkets by Elearnmarkets
November 18, 2020
in Market Analysis, Market Updates
Reading Time: 2 mins read
0
156
VIEWS
Share on FacebookShare on TwitterShare on WhatsApp

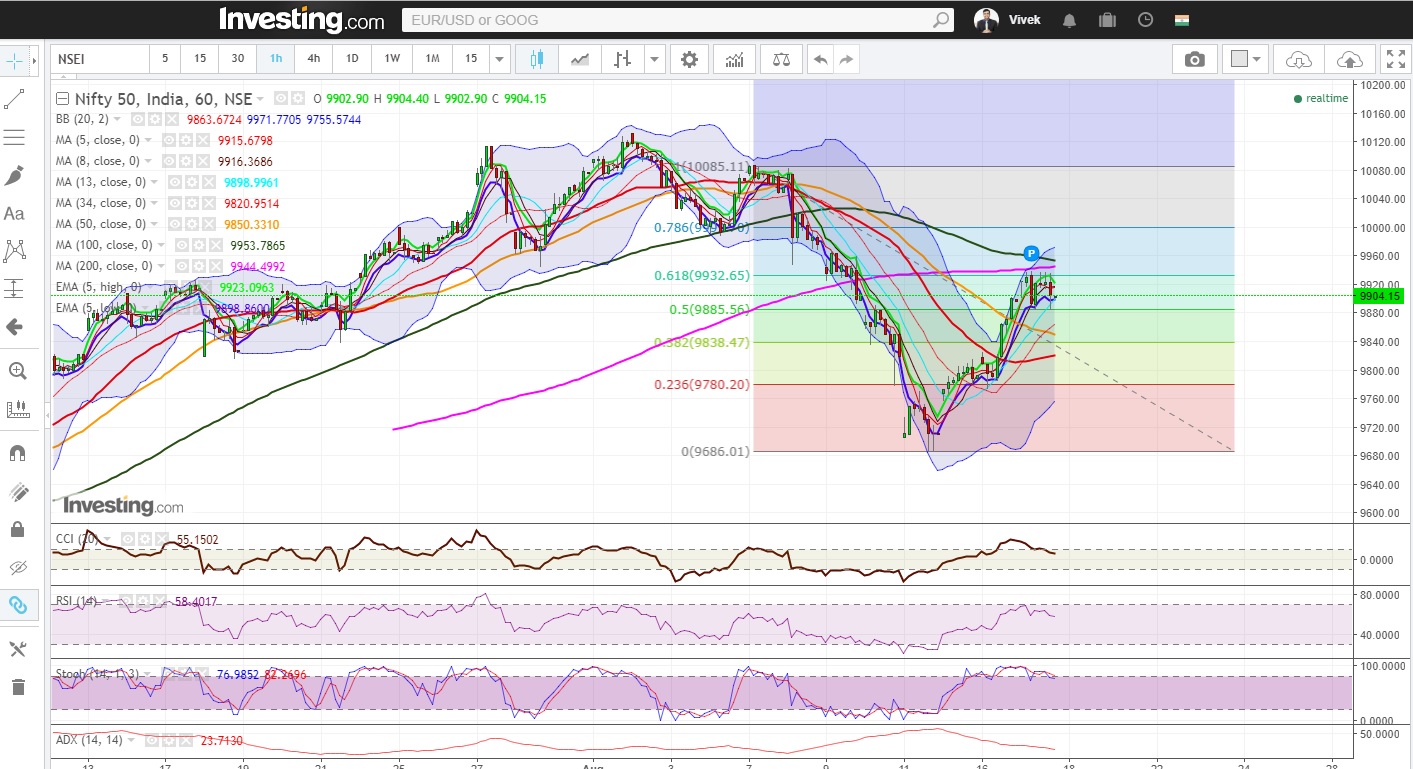
Nifty (Close approx. 9904.15): Nifty opened in green today but there was a tug of war between the bulls and the bears at the resistance of 200 hour moving average (presently at approx. 9944.5).
As mentioned in the last day’s report that a strong resistance is expected at 200 hour moving average (At approx. 9940.2) and Nifty could not breach that level in today’s session.

Hourly Technical:
After a positive open above 9900, Nifty was in a very tight 55 points (9940 – 9885 approx.) range.

The probable support in the hourly chart comes at 20 hour moving average (presently at approx. 9863.7) and 34 hour moving average (presently at approx. 9821). The probable resistance in the hourly chart could be seen at 200 hour moving average (presently at approx. 9944.5).

Subscribe To Webinars Subscribe To Webinars Subscribe To Webinars

The hourly CCI and RSI are in the neutral zone and hourly stochastic is still in the overbought zone. Moreover, the hourly ADX is trending down. Overall these indicators indicate neutral to bullish view in the hourly time frame.

Nifty Hourly Chart

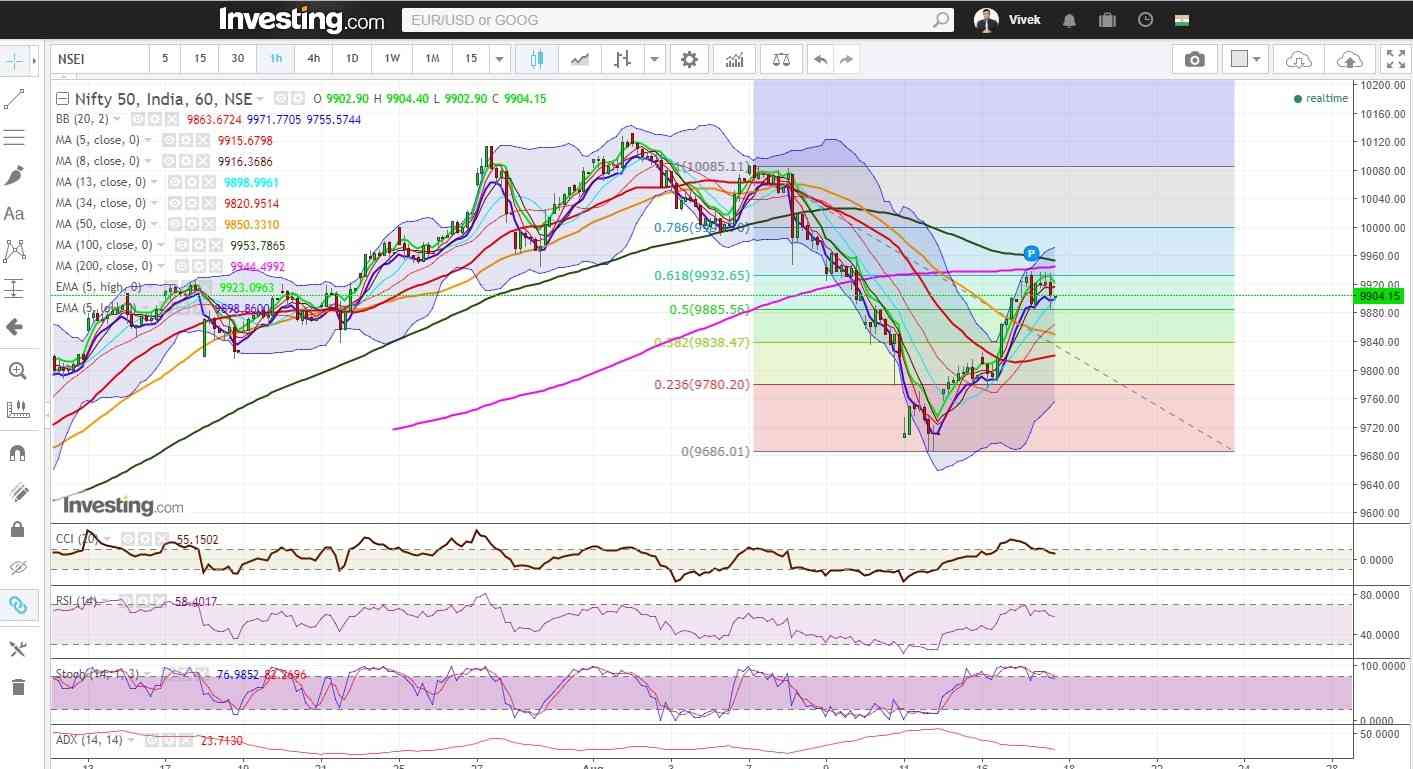
Figure: Hourly Chart

Daily Technical
After a strong two day rally, market consolidates in today’s session and ended flat. In the daily chart, Nifty took support from the 8 DMA (presently at approx. 9883.8).

The next probable support in the daily chart remains at 34 DMA (presently at approx. 9874.1), 5 Day low EMA (presently at approx. 9823.6) and 50 DMA (presently at approx.9787.3). On the upside, the probable resistance could be 20 DMA (presently at approx. 9960) and 78.6% retracement level of the down move from approx. 10088 to aprrox.9686 (presently at approx. 10001.8).

The Daily CCI, RSI and slow stochastic have turned up from the oversold zone which suggests positive bias and Daily ADX is neutral. Overall Nifty in the daily time frame remains neutral to bearish.
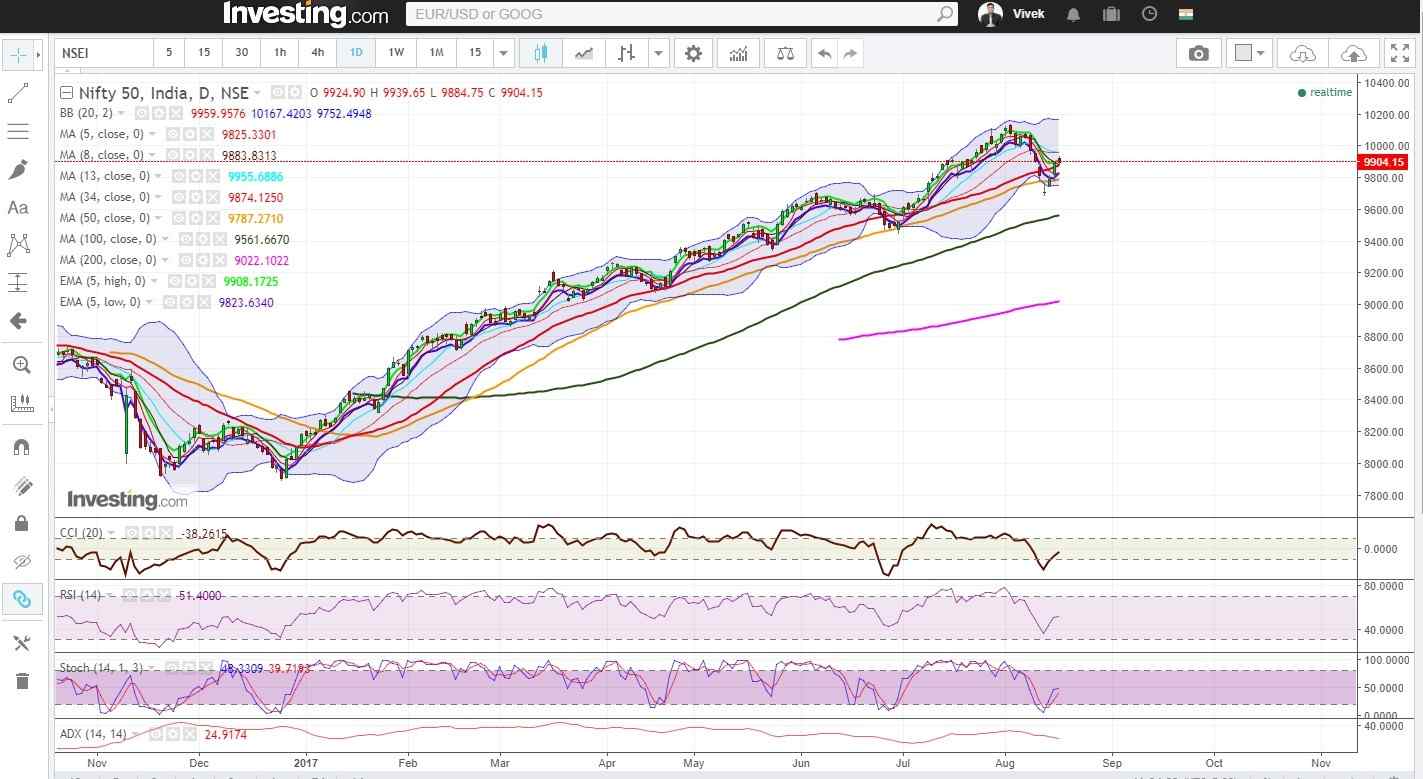
Nifty Daily Chart
Figure: Daily Chart

Nifty Tech Table

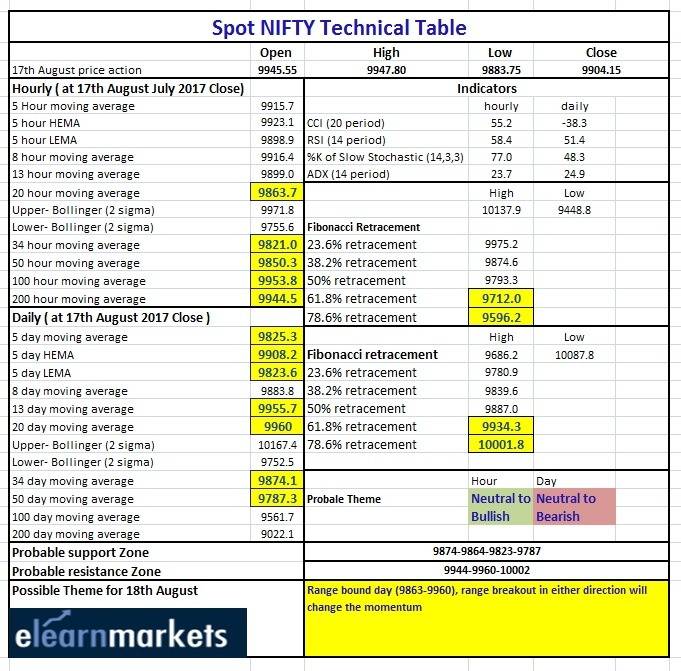
Figure: Nifty Tech Table

Tags: english
ShareTweetSend
Subscribe To Updates On Telegram Subscribe To Updates On Telegram Subscribe To Updates On Telegram
Previous Post

Nifty Opens Gap Up And Steadily Moved Higher To Close Above 5 Day High EMA

Next Post

CANSLIM- the winning Techno-Fundamental strategy

Elearnmarkets

Elearnmarkets

Elearnmarkets (ELM) is a complete financial market portal where the market experts have taken the onus to spread financial education. ELM constantly experiments with new education methodologies and technologies to make financial education effective, affordable and accessible to all. You can connect with us on Twitter @elearnmarkets.

Related Posts

Hourly Chart
Market Analysis

Nifty Ends on Positive Note, Gains Approx. 475 Points on Positive Global Factors

November 18, 2020
373
Weekly Chart
Market Analysis

Huge Sell-Off Makes the Market Close in a Negative Note on the Expiry Week

November 18, 2020
172
Hourly Chart
Market Analysis

Nifty Ends in Green. Rupee Appreciates and Falling Crude Price Helped the Market to Recover Approx. 140 Point

November 18, 2020
126
Hourly Chart
Market Analysis

Sell Off Continues. Nifty Ends The Week With Three Consecutive Red Candles

November 18, 2020
137

Leave a Reply Cancel reply

Your email address will not be published. Required fields are marked *

Follow Us

Facebook-f Twitter Instagram Linkedin-in Youtube Telegram

Register on Elearnmarkets

Continue your financial learning by creating your own account on Elearnmarkets.com

Register Free Account

Download App

Categories

  • Basic Finance
  • Derivatives
  • Financial Planning
  • Fundamental Analysis
  • Technical Analysis
  • Marketshala
  • Miscellaneous

© 2022 Elearnmarkets . All Rights Reserved

  • Visit Elearnmarkets
  • Courses
  • Webinars
  • Financial Guides
  • Get Free Counselling

Get Elearnmarkets App

No Result
View All Result
  • Article Categories
    • Basic Finance
    • Derivatives
    • Financial Planning
    • Fundamental Analysis
    • Technical Analysis
    • Marketshala
    • Miscellaneous
  • Language
    • Hindi
    • Bengali
    • English
  • Courses
  • Webinars

© 2020 Elearnmarkets All Rights Reserved

Welcome Back!

Login to your account below

Forgotten Password?

Retrieve your password

Please enter your username or email address to reset your password.

Log In

Suggested Learning

Technical Analysis Made Easy

Certification in Online Technical Analysis

Online NSE Academy Certified Capital Market Professional (E-NCCMP)