Elearnmarkets - Financial Market Learning
  • Categories
    • Basic Finance
    • Derivatives
    • Financial Planning
    • Fundamental Analysis
    • Technical Analysis
    • Marketshala
    • Miscellaneous
  • Language
    • English
    • Hindi
    • Bengali
No Result
View All Result
  • Courses
  • Webinars
  • Go To Site
  • Login
Elearnmarkets
  • Categories
    • Basic Finance
    • Derivatives
    • Financial Planning
    • Fundamental Analysis
    • Technical Analysis
    • Marketshala
    • Miscellaneous
  • Language
    • English
    • Hindi
    • Bengali
No Result
View All Result
Webinars
Elearnmarkets - Learn Stock Market, trading, investing for Free
No Result
View All Result
Home Technical Analysis Market Analysis

Nifty ends in a positive note amidst Rupee near its lifetime high

Elearnmarkets by Elearnmarkets
November 18, 2020
in Market Analysis, Market Updates, Market Wrap
Reading Time: 2 mins read
0
109
VIEWS
Share on FacebookShare on TwitterShare on WhatsApp

Nifty close 11470.75: After a little correction nifty again back to its lifetime high (presently at approx..11459.95). This week Nifty has been range boundfor the index. Monday nifty gave a gap down opening of 50 points (approximate) which made the bull run a pause. But today’s trading session bring the index back near its life time high.

As the price action suggesting this is just a consolidation phase and bullishness is still intact in the market. There could be some more consolidated trading sessions due to few resistance levels but there is very less chance for the index to go down.

Hourly Technical: Hourly technical suggesting little correction may take place but there is very less chance for any downside because of the Support levels. However, Bullishness may continue once it closes above 11480 level.
Let’s discuss the indicators, RSI is below level 60, Stochastic is in the overbought level, ADX is at approximately 15 level and CCI is just below 100 level (presently at approx.87.40).
So overall, Bullishness is still intact in the market but consolidation is expected. For any downside 11350 level would be support for the index and for resistance last swing high (approx..11495.20) and upper line of the Bollinger Band (presently at approx. 11577) may react.
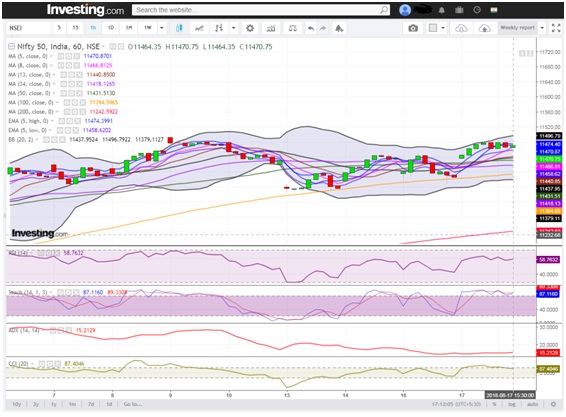
(Hourly chart)

Daily Technical: In the daily chart of Nifty we can observe that the index has closed above the 5EMA (high) which is very positive sign. But resistance level is just above recent price which 11500 level this level is a psychological as well as a technical level. Price closing above this level may attract the bulls again.

Indicator RSI is above 60, Stochastic is above its 90 level (presently at approx.. 90.60), ADX is just below 40 level but slopping down and CCI is above 90.

So indicators are telling the same story. Bullishness is intact but in the short term there could be a chance of consolidation or little correction.
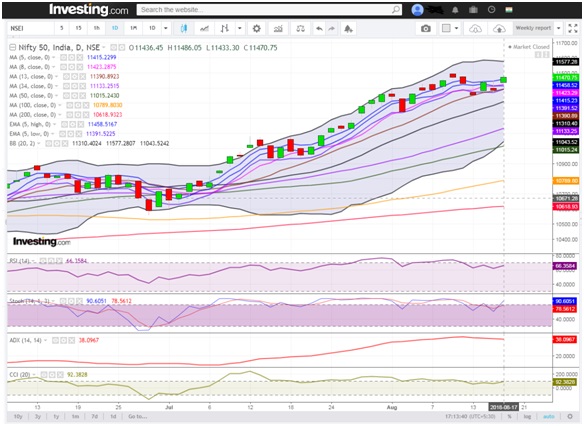
(Daily chart)

Weekly Technical: In the weekly chart as we can see there is no sign of shortfall or correction so in the long run we can expect that the index is very much bullish.

Price is above all the MA lines so in case of downfall there will be huge support for the index. For any upside 11500 going to be the next resistance level for the index. But if it made a close above 11500 level the bull run may start again.

Let’s explore the indicator, RSI is above 70, Stochastic is above 95, ADX is above 20 and CCI is above 160 level but slopping down.

So overall the sentiment is bullish but a correction may take place and very less chance of downfall.
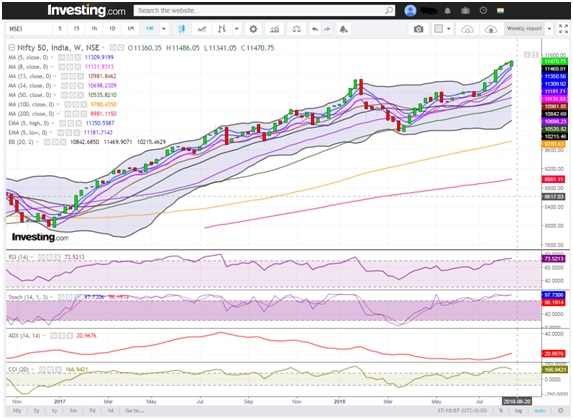
(Weekly chart)

You can use stockedge app to get cutting edge over others in both short term trading and investing. Here you not only get data at one particular place but can also create your own combination scans based on your own technical and fundamental parameter. See the video below to know about various features in Stockedge app.

Tags: english
ShareTweetSend
Subscribe To Updates On Telegram Subscribe To Updates On Telegram Subscribe To Updates On Telegram
Previous Post

How to use Open Interest Strategy to increase profitability?

Next Post

How to calculate Support and Resistance with the help of Open Interest data?

Elearnmarkets

Elearnmarkets

Elearnmarkets (ELM) is a complete financial market portal where the market experts have taken the onus to spread financial education. ELM constantly experiments with new education methodologies and technologies to make financial education effective, affordable and accessible to all. You can connect with us on Twitter @elearnmarkets.

Related Posts

Hourly Chart
Market Analysis

Nifty Ends on Positive Note, Gains Approx. 475 Points on Positive Global Factors

November 18, 2020
360
Weekly Chart
Market Analysis

Huge Sell-Off Makes the Market Close in a Negative Note on the Expiry Week

November 18, 2020
157
Hourly Chart
Market Analysis

Nifty Ends in Green. Rupee Appreciates and Falling Crude Price Helped the Market to Recover Approx. 140 Point

November 18, 2020
121
Hourly Chart
Market Analysis

Sell Off Continues. Nifty Ends The Week With Three Consecutive Red Candles

November 18, 2020
129

Leave a Reply Cancel reply

Your email address will not be published. Required fields are marked *

Follow Us

Facebook-f Twitter Instagram Linkedin-in Youtube Telegram

Download App

Register on Elearnmarkets

Continue your financial learning by creating your own account on Elearnmarkets.com

Register Free Account

Get Articles On Email

Enter your email address:

Categories

  • Basic Finance
  • Derivatives
  • Financial Planning
  • Fundamental Analysis
  • Technical Analysis
  • Marketshala
  • Miscellaneous

© 2022 Elearnmarkets . All Rights Reserved

  • Visit Elearnmarkets
  • Courses
  • Webinars
  • Financial Guides
  • Get Free Counselling

Get Elearnmarkets App

No Result
View All Result
  • Article Categories
    • Basic Finance
    • Derivatives
    • Financial Planning
    • Fundamental Analysis
    • Technical Analysis
    • Marketshala
    • Miscellaneous
  • Language
    • Hindi
    • Bengali
    • English
  • Courses
  • Webinars

© 2020 Elearnmarkets All Rights Reserved

Welcome Back!

Login to your account below

Forgotten Password?

Retrieve your password

Please enter your username or email address to reset your password.

Log In

Suggested Learning

Technical Analysis Made Easy

Certification in Online Technical Analysis

Online NSE Academy Certified Capital Market Professional (E-NCCMP)

ELM School

LOVING OUR BLOGS?

Explore more content for free at ELM School.

Start reading & learning from various text-based modules covering all aspects of finance from today!

VISIT ELM SCHOOL