
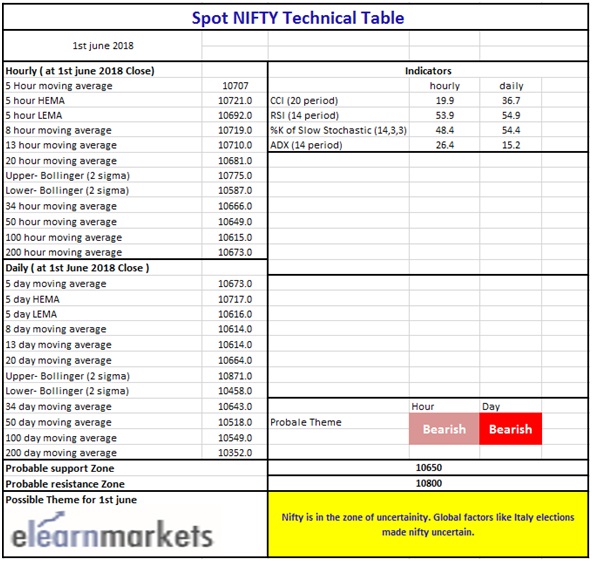
Nifty close 10696.20: Nifty ends this week with a red candle. This was the expiry week for the index as well as global political uncertainty drives the index with no certain direction. However maximum support lines are below the price but the index is losing the momentum (present support at approx. 10650). We may see a range bound movement or a down move from the index.
Hourly Technical
In the hourly chart nifty is trading within a range bound movement. Moving averages are getting tighter. Mid Bollinger band may act as a support (presently at approx. 10681) in the hourly chart.
Short term Moving averages are above the price and they might act as a short term resistance (presently at approx. 10720). If the give a close above the 10750 more upside can be expected.
Indicator RSI is above 50 and ADX slopping down from level 26. From hourly chart we can derive Nifty will remain in a consolidated zone unless it crosses 10750 level. If it breaks in the down side short term MA like 50 and 100 will support the stock.
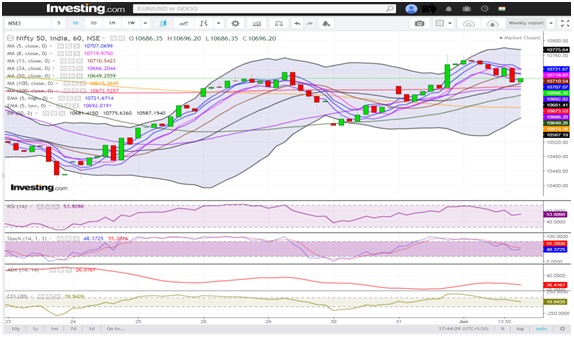
(Hourly chart)
Daily Technical
In the daily chart, of Nifty Moving averages are below the price. Mid Bollinger line (presently at approx. 10664) is also below the price. In case of a downfall we can expect the index may take support from 10600 level. MA line 50 at 10518, MA 100 at 10549 and MA 200 is at 10352.
Indicator RSI is slopping down towards level 50 from level 55. Stochastic is hovering at normal zone (presently at approx. 54). ADX is below its 20 level. Overall indicators are not suggesting any possible trend however 10750 to 10800 is going to be very important level for the index for next week.
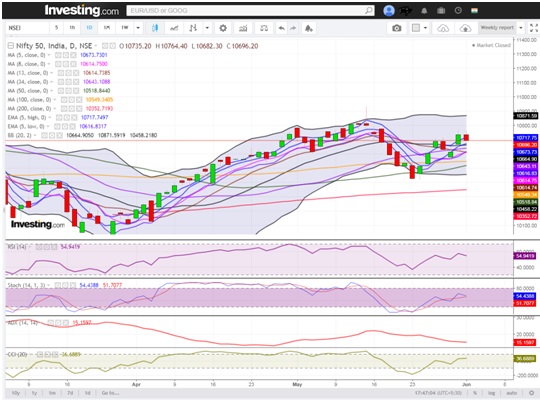
(Daily chart)
Weekly Technical
According to the weekly chart, Nifty has no certain direction and it is range bound for now.
DMA 13 AND DMA 5 is acting as support. Lower Bollinger Band is also acting as asupport to this zone. It seems that Nifty will have difficulty in crossing 10800 zone, if it crosses this zone then we can expect the index to become bullish.
Indicator RSI is just below 60 and it is totally flat. Stochastic is also at the normal zone. Indicator ADX is sloping downwards and it is just above level 15. While Indicator CCI is about to cross level 50.
Overall all the indicators are suggesting no particular direction for the index. Global factors and oil price could be the major factors for the index in the upcoming week.
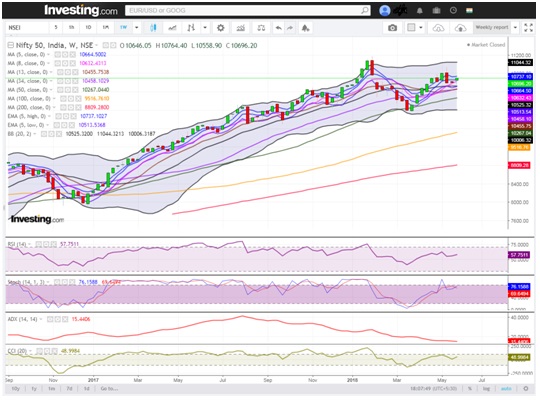
(Weekly chart)
You can use stockedge app to get cutting edge over others in both short term trading and investing. Here you not only get data at one particular place but can also create your own combination scans based on your own technical and fundamental parameter. See the video below to know about various features in Stockedge app.


