Elearnmarkets - Financial Market Learning
  • Categories
    • Basic Finance
    • Derivatives
    • Financial Planning
    • Fundamental Analysis
    • Technical Analysis
    • Marketshala
    • Miscellaneous
  • Language
    • English
    • Hindi
    • Bengali
No Result
View All Result
  • Courses
  • Webinars
  • Go To Site
  • Login
Elearnmarkets
  • Categories
    • Basic Finance
    • Derivatives
    • Financial Planning
    • Fundamental Analysis
    • Technical Analysis
    • Marketshala
    • Miscellaneous
  • Language
    • English
    • Hindi
    • Bengali
No Result
View All Result
Webinars
Elearnmarkets - Learn Stock Market, trading, investing for Free
No Result
View All Result
Home Technical Analysis Market Analysis
Nifty Hourly Chart

Nifty Fell For The Third Consecutive Day, Closes Below 20 DMA

Elearnmarkets by Elearnmarkets
November 18, 2020
in Market Analysis, Market Updates
Reading Time: 2 mins read
0
39
VIEWS
Share on FacebookShare on TwitterShare on WhatsApp

Nifty (Close approx. 9908.05)

The market fell for the third consecutive session on Wednesday.

In today’s session, Nifty was down by 70.50 points and in the daily time frame, the 20 DMA or mid-Bollinger support (at approx. 9974.7) got broke and faced strong resistance (the Bearish tone was stated in yesterday’s report below 9970).

Nifty opened gap down pulled back and after making an intraday high of 9969, slipped about 75 points subsequently.
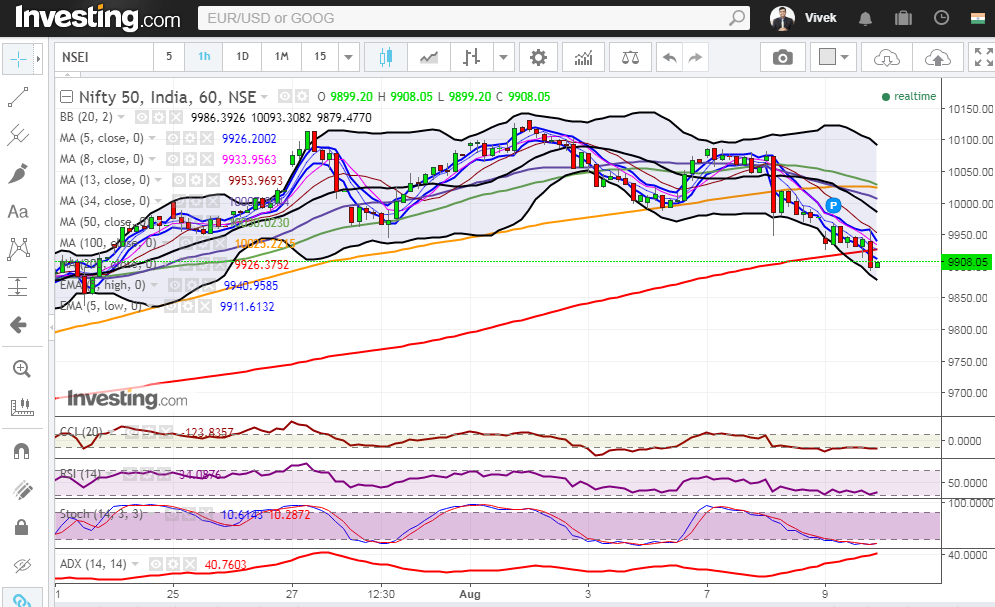
Subscribe To Webinars Subscribe To Webinars Subscribe To Webinars

Hourly Technical:

In the hourly chart, Nifty is bearish, but oscillators (slow stochastic, CCI) are in the oversold zone.

Hence, there is a possibility of a  pullback to short-term moving averages.

The probable resistance in the hourly chart could be seen at 200-hour moving average (presently at approx9926.4), 8 hours moving average (presently at approx 9934), 13-hour moving average (presently at approx 9954) and 20 hours moving average (presently at approx9986.4).

The probable support in the hourly chart could be seen at 38.2% Fibonacci retracement (presently at approx 9874.6).

The expected downward price level based on Fibonacci retracement of the up move from the previous bottom (approx. 9448.8 to 10137.9) comes at 9874.6 (38.2%), 9793.3 (50%), 9712 (61.8%) and 9896.2 (78.6%).

Hourly RSI is close to lower bound of the normal region.

Moreover, the rising ADX line also suggests downside momentum in the hourly price chart. Overall Nifty remains bearish in the hourly time frame.

Nifty Hourly Chart

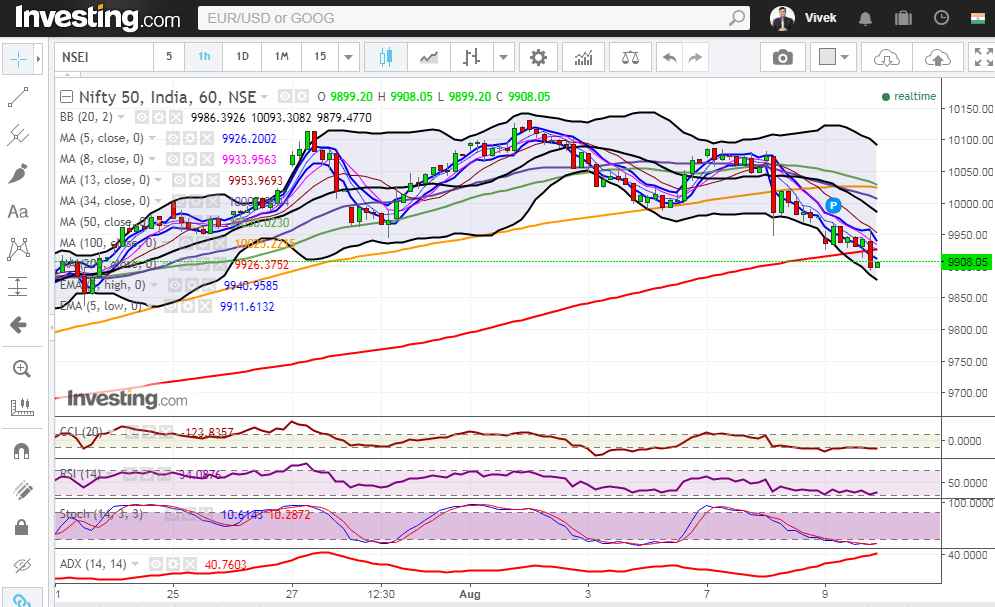
Figure: Nifty Hourly Chart

Daily Technical:

In the daily time frame, the market broke 20 DMA or mid-Bollinger support (at approx 9974.7) with a gap down.

The 20 DMA line acted as a good resistance in today’s trade and gave a good correction after making a high of 9969 in the very first hour.

The next probable support in the daily chart remains at 34 DMA (presently at approx 9832.5), 50 DMA (presently at approx 9768.8).

The uptrend which started in the last week of December 2016 is still intact and the fall in the last few days could be a mere correction.

However, 50 DMA (at approx. 9870) and uptrend support (at approx. 9890) could act as a strong support for Nifty in the coming days.

On the upside, the probable resistance could be seen at 5 day low EMA (presently at approx 9961), 20 DMA (presently at approx 9974.7) and 5 DMA (presently at approx 10004.8).

Daily CCI, RSI and slow stochastic have turned down from the overbought zone which is a moderate bearish signal as of now.

Overall, Nifty in the daily time frame remains reasonably bearish in the near short term.

Become a technical analysis expert by joining: NSE Academy Certified Technical Analysis course.

Nifty Daily Chart

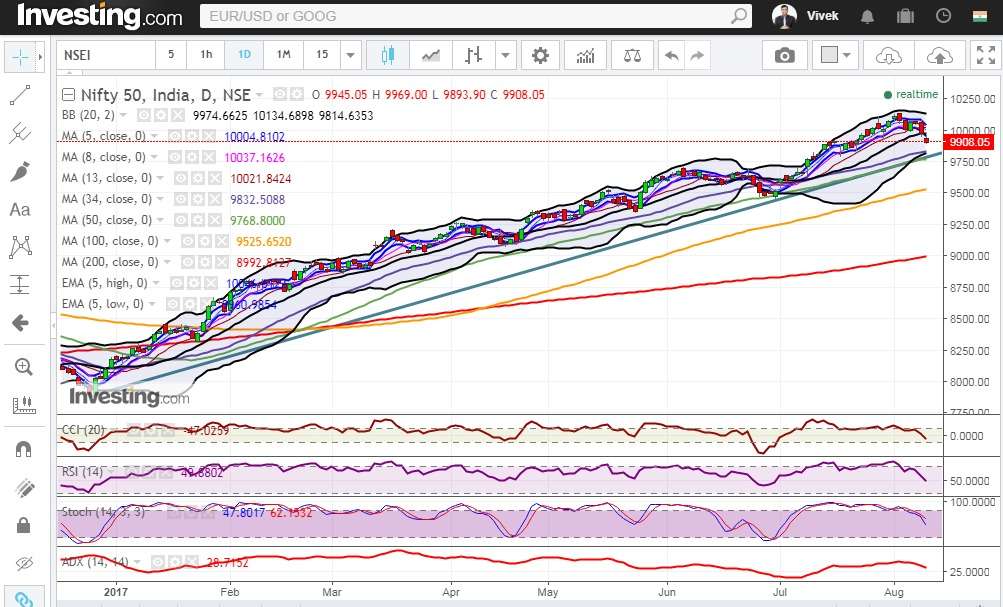
Figure: Nifty Daily Chart

Nifty Tech Table

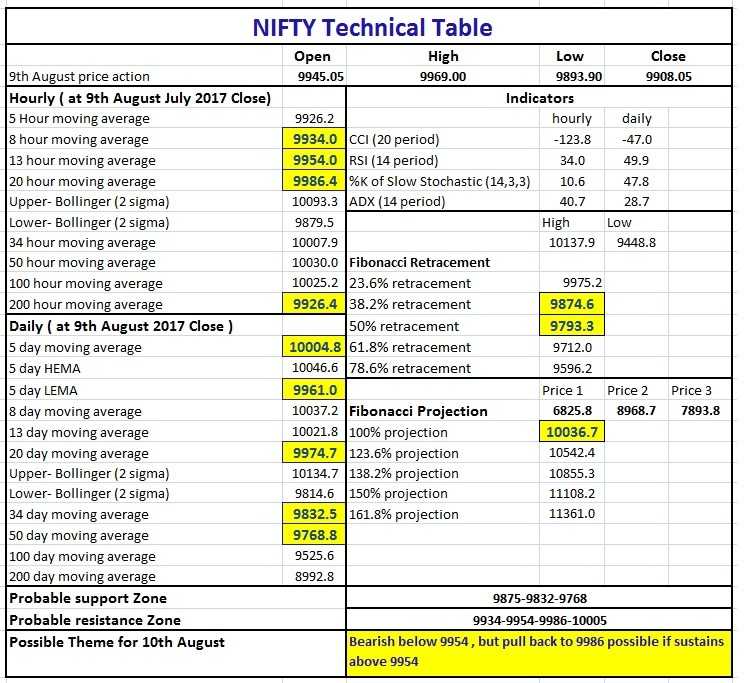
Figure: Nifty Tech Table

Watch the video below to know how to interpret the above table:

Tags: english
ShareTweetSend
Subscribe To Updates On Telegram Subscribe To Updates On Telegram Subscribe To Updates On Telegram
Previous Post

SEBI Order On Shell Firms Hurts Market Sentiment, Nifty Below 10k Mark

Next Post

Nifty At Make Or Break Juncture Of 8 Month Old Uptrend, Managed To Close Above 50 DMA

Elearnmarkets

Elearnmarkets

Elearnmarkets (ELM) is a complete financial market portal where the market experts have taken the onus to spread financial education. ELM constantly experiments with new education methodologies and technologies to make financial education effective, affordable and accessible to all. You can connect with us on Twitter @elearnmarkets.

Related Posts

Hourly Chart
Market Analysis

Nifty Ends on Positive Note, Gains Approx. 475 Points on Positive Global Factors

November 18, 2020
373
Weekly Chart
Market Analysis

Huge Sell-Off Makes the Market Close in a Negative Note on the Expiry Week

November 18, 2020
171
Hourly Chart
Market Analysis

Nifty Ends in Green. Rupee Appreciates and Falling Crude Price Helped the Market to Recover Approx. 140 Point

November 18, 2020
126
Hourly Chart
Market Analysis

Sell Off Continues. Nifty Ends The Week With Three Consecutive Red Candles

November 18, 2020
137

Leave a Reply Cancel reply

Your email address will not be published. Required fields are marked *

Follow Us

Facebook-f Twitter Instagram Linkedin-in Youtube Telegram

Register on Elearnmarkets

Continue your financial learning by creating your own account on Elearnmarkets.com

Register Free Account

Download App

Categories

  • Basic Finance
  • Derivatives
  • Financial Planning
  • Fundamental Analysis
  • Technical Analysis
  • Marketshala
  • Miscellaneous

© 2022 Elearnmarkets . All Rights Reserved

  • Visit Elearnmarkets
  • Courses
  • Webinars
  • Financial Guides
  • Get Free Counselling

Get Elearnmarkets App

No Result
View All Result
  • Article Categories
    • Basic Finance
    • Derivatives
    • Financial Planning
    • Fundamental Analysis
    • Technical Analysis
    • Marketshala
    • Miscellaneous
  • Language
    • Hindi
    • Bengali
    • English
  • Courses
  • Webinars

© 2020 Elearnmarkets All Rights Reserved

Welcome Back!

Login to your account below

Forgotten Password?

Retrieve your password

Please enter your username or email address to reset your password.

Log In

Suggested Learning

Technical Analysis Made Easy

Certification in Online Technical Analysis

Online NSE Academy Certified Capital Market Professional (E-NCCMP)