Elearnmarkets - Financial Market Learning
  • Categories
    • Basic Finance
    • Derivatives
    • Financial Planning
    • Fundamental Analysis
    • Technical Analysis
    • Marketshala
    • Miscellaneous
  • Language
    • English
    • Hindi
    • Bengali
No Result
View All Result
  • Courses
  • Webinars
  • Go To Site
  • Login
Elearnmarkets
  • Categories
    • Basic Finance
    • Derivatives
    • Financial Planning
    • Fundamental Analysis
    • Technical Analysis
    • Marketshala
    • Miscellaneous
  • Language
    • English
    • Hindi
    • Bengali
No Result
View All Result
Webinars
Elearnmarkets - Learn Stock Market, trading, investing for Free
No Result
View All Result
Home Technical Analysis Market Analysis
Nifty Hourly Chart

Nifty Opens Gap Up And Steadily Moved Towards 9818 Resistance

Elearnmarkets by Elearnmarkets
November 18, 2020
in Market Analysis, Market Updates
Reading Time: 2 mins read
0
37
VIEWS
Share on FacebookShare on TwitterShare on WhatsApp

Nifty (Close approx. 9794.15): Market opens gap up and closed in green in today’s session with today’s price action confirming inverted hammer candlestick pattern in the daily chart.

As mentioned in the last day’s report that a strong pullback is possible if Nifty sustains above 9774 and at the same time there was a strong resistance in the hourly chart (9818-mentioned in tech table) from where the market saw profit booking today in the last one hour.
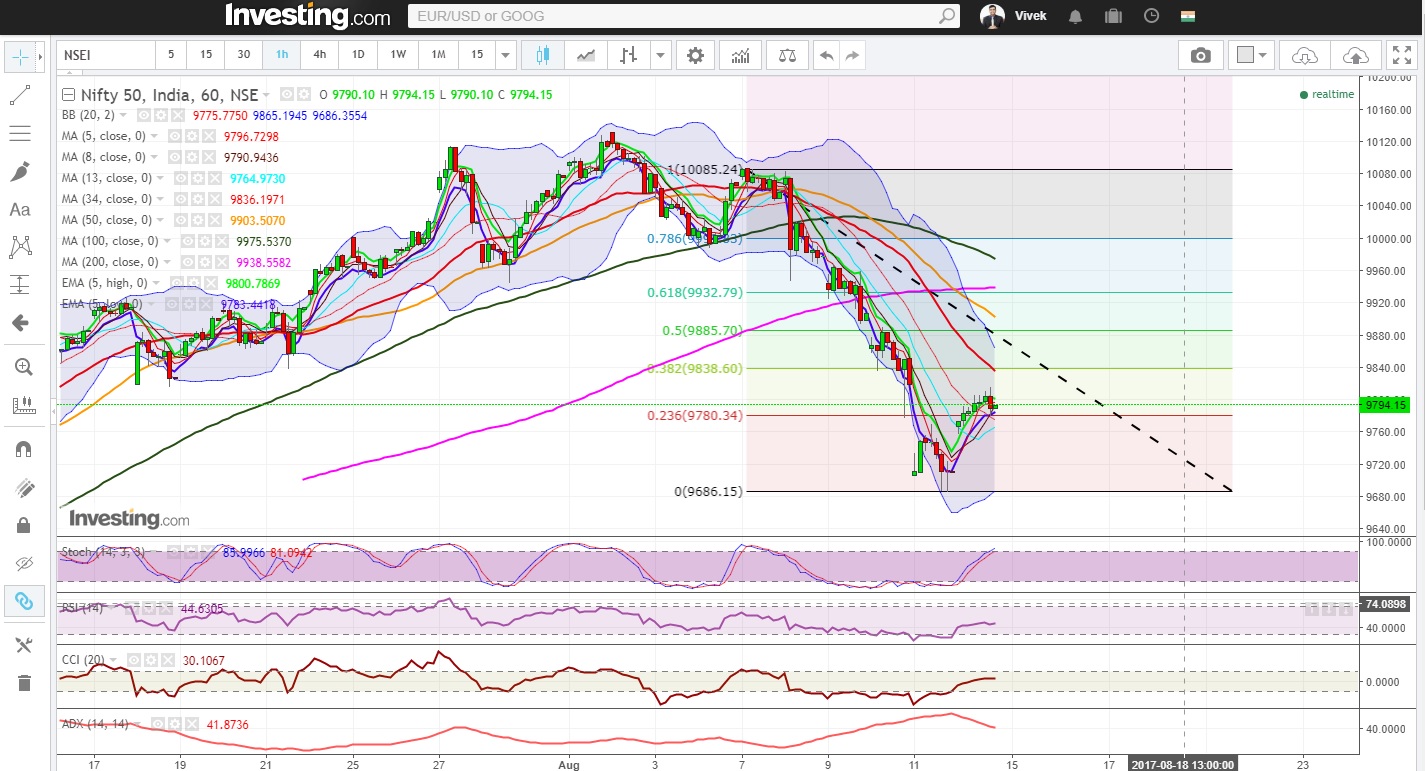
Hourly Technical:

Nifty opened gap up by more than 50 points and was up for most part of the day. The close above the mid Bollinger line (presently at approx 9775.8) is positive in the short term, however the 34 DMA line (presently at approx. 9836.2) may act as a strong resistance in the near term. Unless Nifty closes and sustains above the 34 hourly moving average, market remains neutral to bearish in the hourly chart.

Subscribe To Webinars Subscribe To Webinars Subscribe To Webinars

The probable support in the hourly chart comes at 20 hours moving average (presently at approx. 9775.8), 61.8% retracement (presently at approx. 9712) and lower Bollinger line (presently at approx. 9686.4). The probable resistance in the hourly chart could be seen at 34 hour moving average (presently at approx. 9836.2) and 50 hour moving average (presently at approx. 9903.5).

The expected downward price level based on Fibonacci retracement of the up move from the previous bottom (approx.9448.8. to 10137.9) comes at 9712 (61.8%) and 9596.2 (78.6%).

The hourly CCI, RSI are in neutral zone and hourly stochastic has just entered in the overbought zone. Moreover, the hourly ADX is trending down. Overall these indicators indicate neutral view in hourly time frame.

Nifty Hourly Chart

Figure: Nifty Hourly Chart


Daily Technical

Nifty was up by 83.35 points in today’s trade. In daily time, though Nifty is able to close above 50 DMA (presently at approx. 9777.5), it could not close above the 5 day Low EMA (presently at approx. 9804.7)which is still a concern for bulls and may act as a resistance in the daily time frame. The market sentiment will turn bullish only if Nifty closes above 5 Day High EMA (presently at approx. 9886).

The next probable support in the daily chart remains at lower Bollinger line (presently at approx. 9742.1). On the upside, the probable resistance could be 5 Day Low EMA (presently at approx. 9804.7), 5 day moving average (presently at approx. 9842.40) and 5 Day High EMA (presently at approx. 9886.1).

Slow stochastic and RSI are still close to their lower bound Moreover; CCI is still below -100 line which suggest that bears are still having control in daily timeframe, in spite of today’s up move. Overall Nifty remains neutral to bearish in the daily time frame.

Nifty Daily Chart

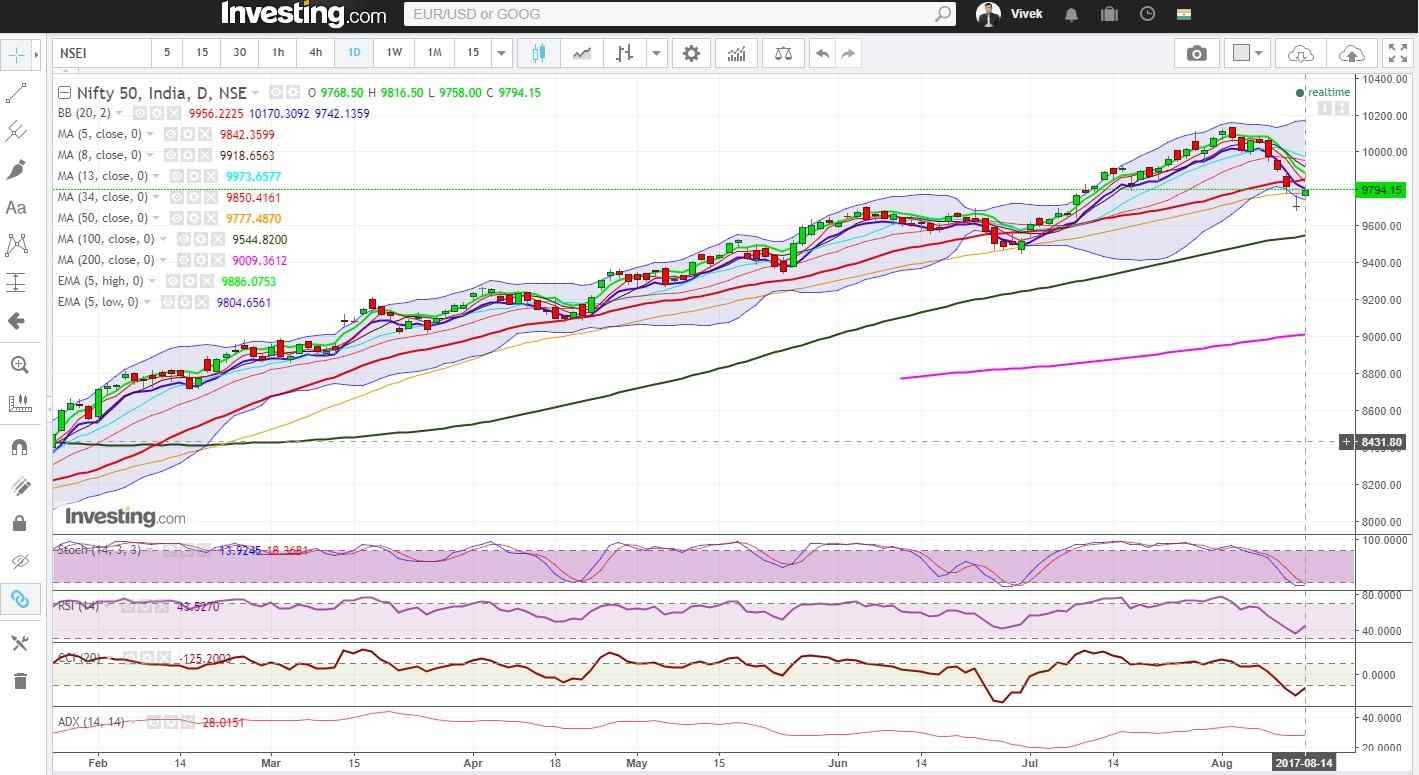
Figure: Nifty Daily Chart

Nifty Tech Table

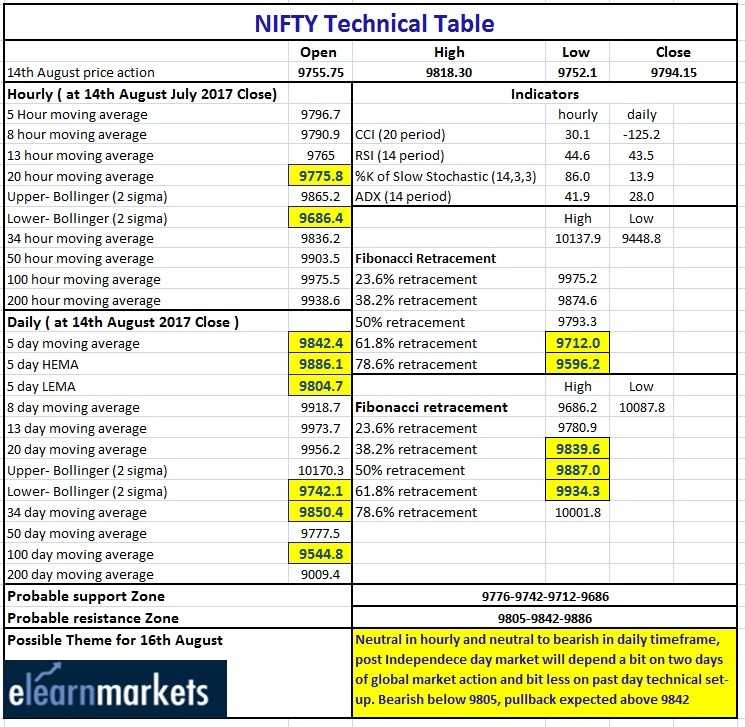
Figure: Nifty Tech Table


Tags: english
ShareTweetSend
Subscribe To Updates On Telegram Subscribe To Updates On Telegram Subscribe To Updates On Telegram
Previous Post

Nifty Breaks And Closes Below Important 50 DMA Support First Time Last 7 Months

Next Post

Nifty Opens Gap Up And Steadily Moved Higher To Close Above 5 Day High EMA

Elearnmarkets

Elearnmarkets

Elearnmarkets (ELM) is a complete financial market portal where the market experts have taken the onus to spread financial education. ELM constantly experiments with new education methodologies and technologies to make financial education effective, affordable and accessible to all. You can connect with us on Twitter @elearnmarkets.

Related Posts

Hourly Chart
Market Analysis

Nifty Ends on Positive Note, Gains Approx. 475 Points on Positive Global Factors

November 18, 2020
373
Weekly Chart
Market Analysis

Huge Sell-Off Makes the Market Close in a Negative Note on the Expiry Week

November 18, 2020
171
Hourly Chart
Market Analysis

Nifty Ends in Green. Rupee Appreciates and Falling Crude Price Helped the Market to Recover Approx. 140 Point

November 18, 2020
126
Hourly Chart
Market Analysis

Sell Off Continues. Nifty Ends The Week With Three Consecutive Red Candles

November 18, 2020
137

Leave a Reply Cancel reply

Your email address will not be published. Required fields are marked *

Follow Us

Facebook-f Twitter Instagram Linkedin-in Youtube Telegram

Register on Elearnmarkets

Continue your financial learning by creating your own account on Elearnmarkets.com

Register Free Account

Download App

Categories

  • Basic Finance
  • Derivatives
  • Financial Planning
  • Fundamental Analysis
  • Technical Analysis
  • Marketshala
  • Miscellaneous

© 2022 Elearnmarkets . All Rights Reserved

  • Visit Elearnmarkets
  • Courses
  • Webinars
  • Financial Guides
  • Get Free Counselling

Get Elearnmarkets App

No Result
View All Result
  • Article Categories
    • Basic Finance
    • Derivatives
    • Financial Planning
    • Fundamental Analysis
    • Technical Analysis
    • Marketshala
    • Miscellaneous
  • Language
    • Hindi
    • Bengali
    • English
  • Courses
  • Webinars

© 2020 Elearnmarkets All Rights Reserved

Welcome Back!

Login to your account below

Forgotten Password?

Retrieve your password

Please enter your username or email address to reset your password.

Log In

Suggested Learning

Technical Analysis Made Easy

Certification in Online Technical Analysis

Online NSE Academy Certified Capital Market Professional (E-NCCMP)