One of the most widely utilized momentum oscillators in the field of technical stock analysis is the Relative Strength Index (abbreviated RSI). Welles Wilder first presented it in June 1978, and his book New Concepts in Technical Trading System goes into great depth about how it is calculated.
A momentum oscillator calculates the speed and amount of a security’s price changes. RSI uses a security’s average gains and losses over a predefined period of time to compare and determine the strengths and weaknesses of the security.
In today’s blog let us discuss how we can
Relative Strength Index Formula and Range
RSI or Relative Strength Index is an oscillator (which moves to and fro within a range, which is 0 to 100 in the case of RSI).
This is one of the most used leading indicators (leading, because trading signals are generated before anticipated price movements).
J. Welles Wilder, Jr. introduced the Relative Strength Index, which measures the velocity of price movements of trading instruments (stocks, commodity futures, bonds, forex etc.) over a specified period of time.
The formula for calculating RSI is as follows
RSI = 100 – 100 / (1 + RS)
RS = Average Gain over specified period/ Average loss over the same period
Trading with Relative Strength Index
Below are the following ways to trade with RSI Indicator-
1. Relative Strength Index Overbought and Oversold region
RSI upper and lower bound are 100 and 0 respectively and the specified period used is generally 14 days. A user is free to alter the period count to suit his analysis.
A lower period count (like 10) will generate more frequent buy and sell signals (also wrong signals with more frequency) and a higher period count (like 20) will generate a lesser number of buy and sell signals (with a probability of excluding some genuine buy and sell signals generated in 14 periods).
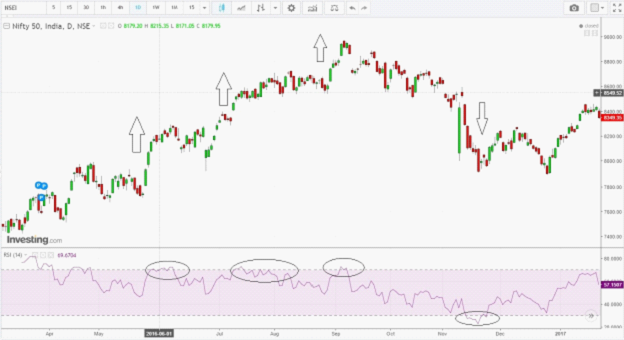
Normally, when a stock or a financial instrument is having its RSI value above 70 it is said to be in an overbought region, while a value below 30 is considered to be in the oversold region as shown in figure 1 below, in Nifty daily chart.
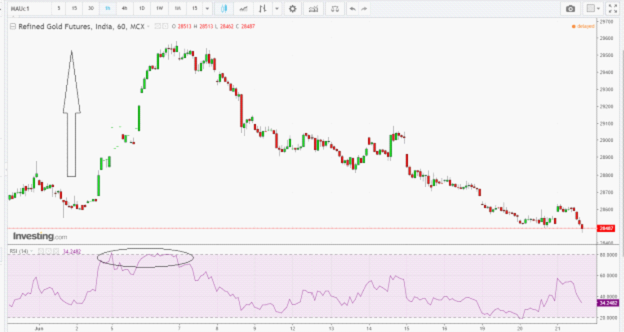
In a more volatile market or a strong bull market, a user can define above 80 levels as overbought level as shown in figure 2, in MCX gold hourly chart.
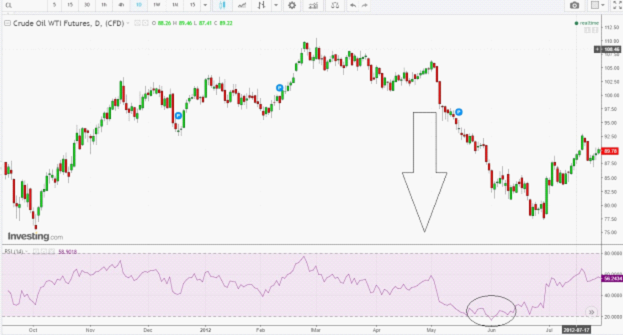
In a similar volatile market and a strong bear market below 20 level as an oversold region. We can see below in figure 3 (a daily chart of WTI crude oil)
2. Trading signals
The RSI Trading strategy is used in more than one way to either initiate a fresh position or close a previously open position.
Generally, using them along with some other indicators like Slow stochastic, Bollinger band and price patterns (like candlesticks or classical reversal patterns, flag, wedge, head & shoulder etc. ) give better results than solely depending on the RSI indicator.
3. Trading overbought and oversold levels of RSI
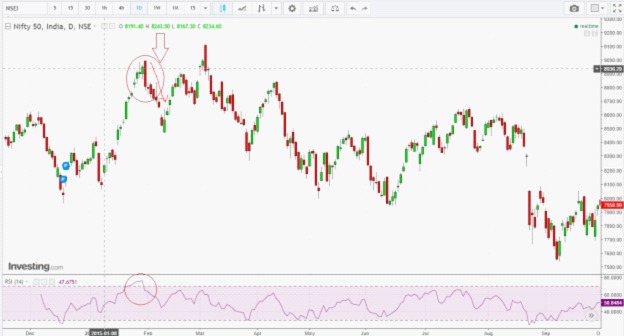
When RSI enters ‘30-70’ zone from an overbought region and if there is a simultaneous bearish pattern in the chart, the market usually follows it up with a bearish down move.
In figure 4, in Nifty 50 daily chart, we see RSI entering ’30-70’ zone, from the overbought region, and a simultaneous bearish engulfing pattern is formed in the chart. This is followed by a tradable down move of 400 points (figure 4).
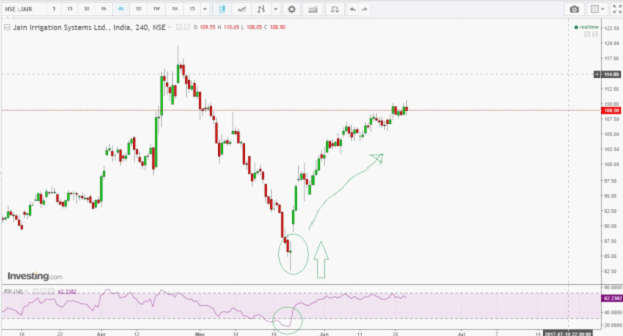
Similarly, when an instrument enters ‘30-70’ zone, from an oversold region and if there is a simultaneous occurrence of a bullish reversal pattern in price chart, we can see a follow-up up move.
In Figure 5, in the recent 4 hourly charts of Jain Irrigation, we can see RSI entering the’30-70’ zone from an oversold region and we can see a follow-up upward movement after confirmation of hammer in candlestick chart (figure 5).
4. Trading RSI divergences
Often it is observed that there are divergences between price and RSI movement.
In an uptrend, when price keeps on making higher highs, while RSI indicator fails to make newer highs, a bearish divergence is created.
These kinds of divergences can be traded on the downside, once a bearish reversal pattern is confirmed or a support level is taken out.
In the following weekly chart of Sun Pharma, such a divergence is clearly visible (figure 6).
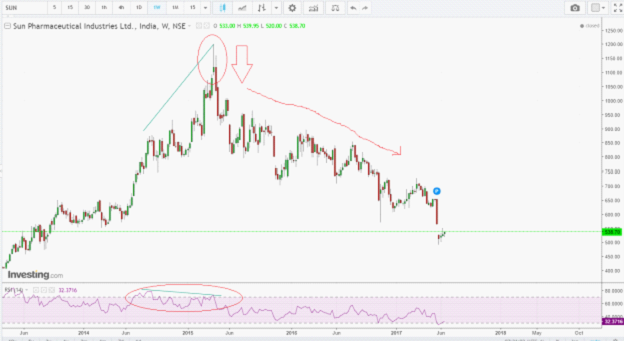
Even if we see that prices are at previous high, while RSI is at a much lower level than that corresponds to the previous high, one should keep a vigilant eye for bearish reversal price pattern.
A bearish reversal can provide a good follow up down move.
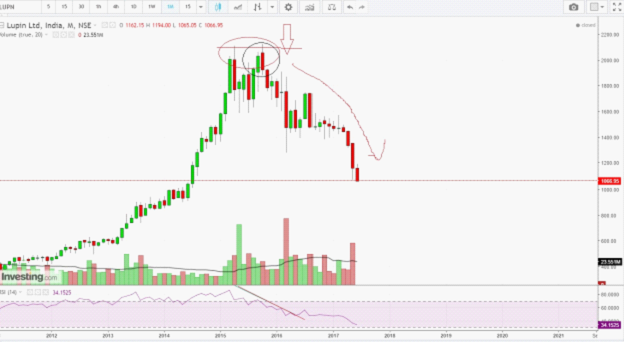
In the following Lupin monthly chart, we can find that prices have come back to previous high, while the monthly RSI shows, considerable bearish divergence.
Then after a dark cloud cover is confirmed in the price chart, we see a substantial down move (figure 7).
In a similar way, a bullish divergence is formed when we see, prices are making newer lows, while RSI indicator fails to make newer lows.
A decisive break above with a significant reversal pattern often provides good upside.
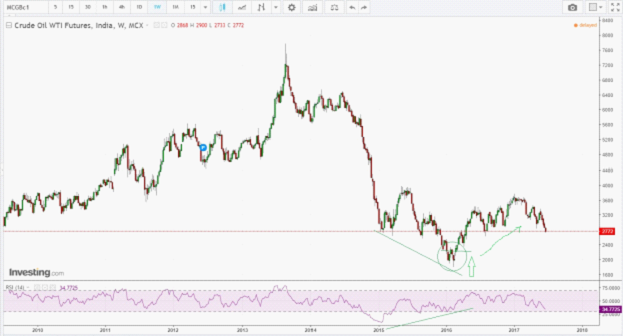
In the following weekly chart of MCX crude oil, such a divergence was visible.
When the prices broke above the double bottom chart pattern, we got a good 50 % rally from 2400 to 3600 (figure 8).
Even if the prices come down to the previous lows while RSI shows divergence, we should be looking for any possible bullish reversal.
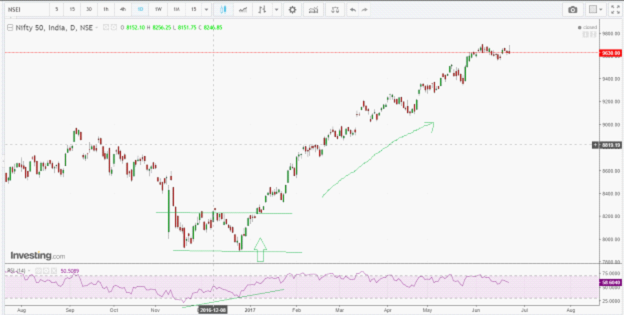
Here in the Nifty daily chart, RSI showed bullish divergence with price moving to previous low, while RSI making a higher low.
Eventually, a break above this double bottom resulted in a significant rally (figure 9).
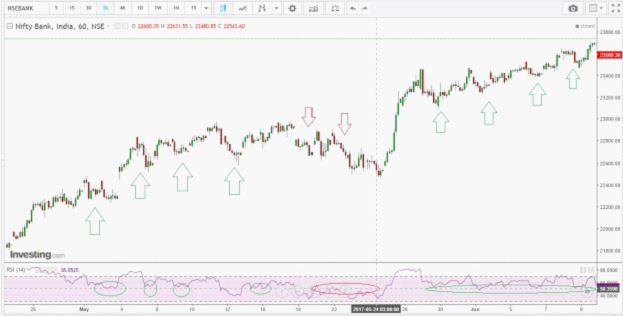
5. Support resistance at the midpoint of RSI line during bull and bear phases
In a bull phase of the market, the mid-line (50) of RSI ’30-70’ range provides multiple low-risk buying opportunities as the RSI spends most of the time between 50-80.
In a bear phase midline (50) provides multiple shorting opportunities as RSI spend most of the time in 50-20 range.
In the following hourly chart of the Bank Nifty, we can see both the scenarios highlighted (figure 10).
Get to know about effective use of RSI Indicator for successful trading.
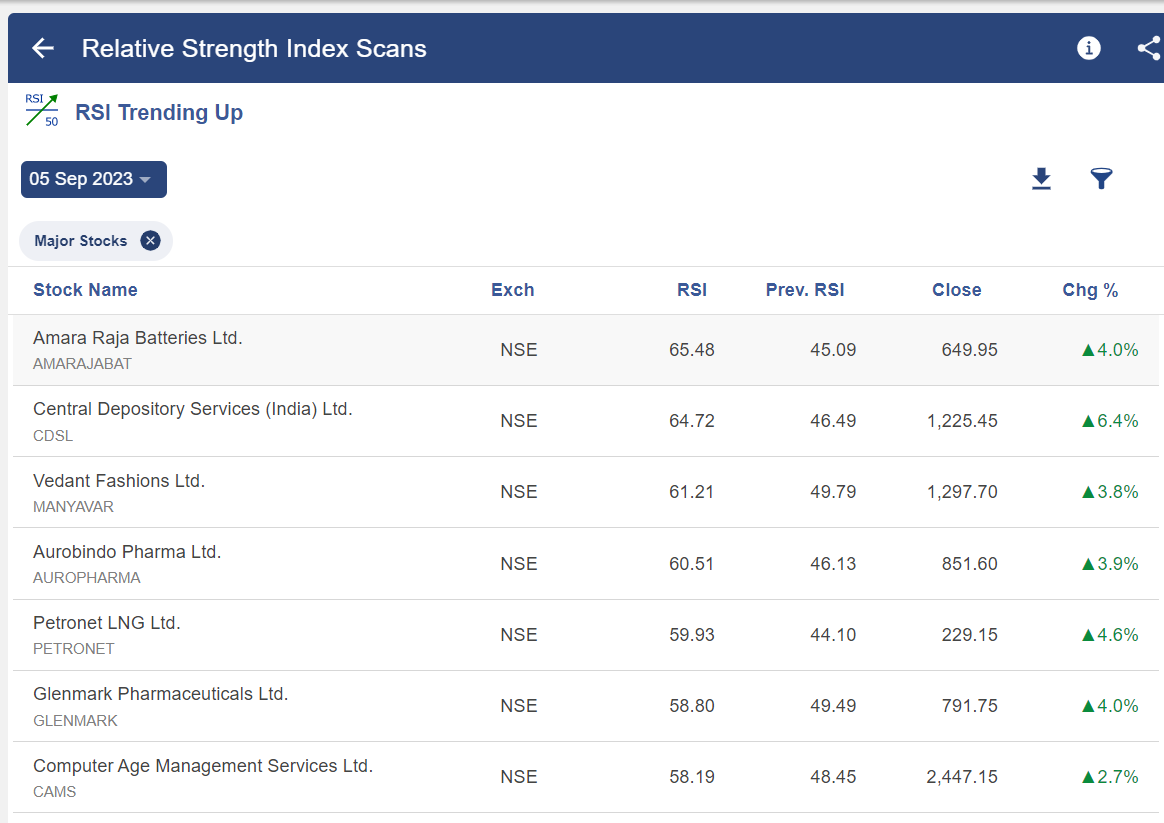
Using the Relative Strength Index Scans with the help of StockEdge
Below are the RSI Scans available in StockEdge through which you can filter out stocks based on the following criteria:
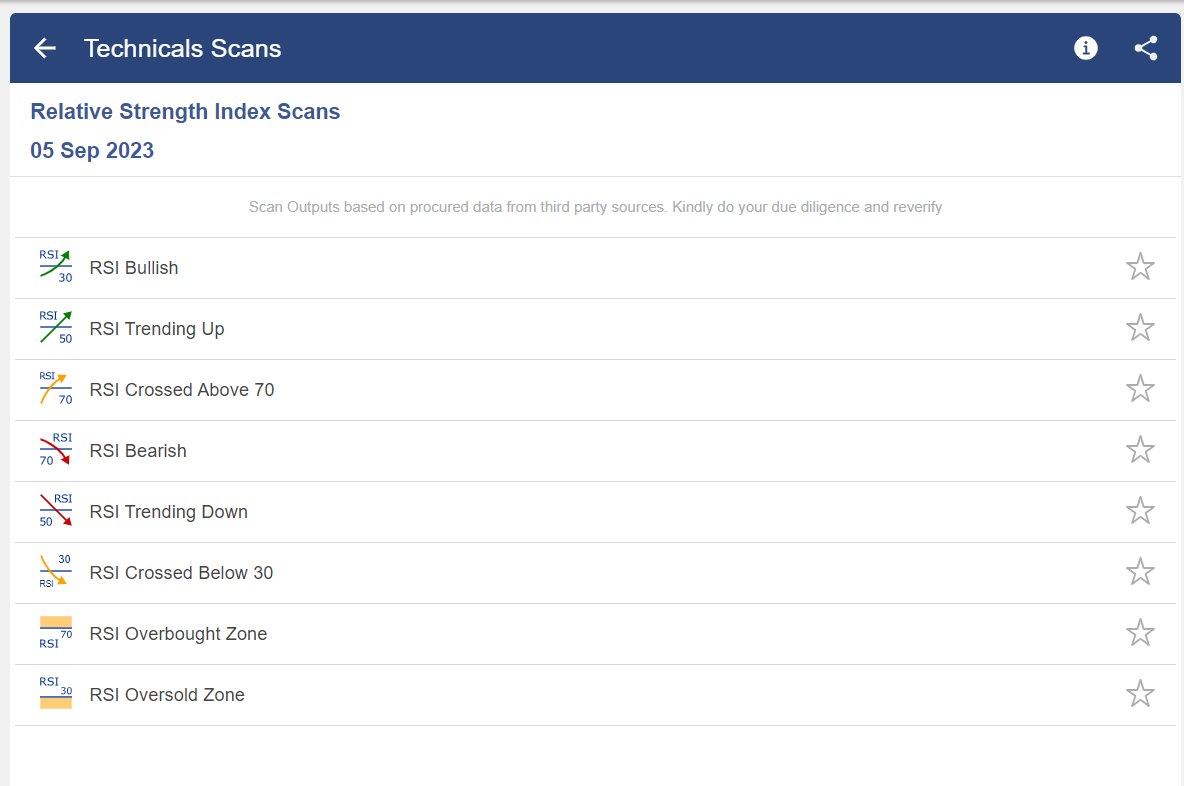
Once you select any of the scans above, you will get a list of stocks, that fulfil that criteria as shown below:
Bottomline
The quality of a buy or a sell signal generally depends upon the inherent characteristics of the underlying security. Thus, RSI should be used in tandem with other technical indicators to generate better trading signals.
Frequently Asked Questions (FAQs)
What is a good RSI indicator?
When the RSI falls below 30, it suggests an oversold or undervalued situation and produces purchase recommendations. Sell signals are produced by high RSI readings, above 70, which indicate that an investment is either overbought or overvalued. A score of 50 indicates a middle ground or equilibrium between optimistic and pessimistic perspectives.
How is RSI calculated?
RSI oscillates on a scale of zero to 100. It is usually depicted graphically. The formula to calculate RSI is: RSI = 100 – [100 ÷ ( 1 + (Average Gain During Up Periods ÷ Average Loss During Down Periods ))]
Which RSI is bullish?
The 40–50 zone serves as support for the RSI, which often stays in the 40–90 range during an uptrend or bull market. The RSI often remains in the 10 to 60 range during a decline or bear market, with the 50–60 zone serving as resistance.


Thanks a lot. This is great content. I might share some for you guys too. Great work poster!
Thanks, very useful information in easy manner with chats.
These articles really helped me to understand the subject in more details.
Thanks a lot.
Hi,
We really appreciated that you liked our blog.
Keep Reading!!