Key Takeaways:
- RSI indicator (Relative Strength Index) is a technical analysis indicator used to measure the change in price momentum.
- Above 70 the stock is considered to be overbought and below 30, the stock is considered to be oversold.
- RSI in stock market also helps us in spotting bullish and bearish divergences that signal bullish and bearish reversal respectively.
- The signal generated by RSI should be confirmed with other technical indicators and price actions.
- RSI is most trustworthy in an oscillating market when the price is shifting between bullish and bearish periods.
| Table of Contents |
|---|
| What is Relative Strength Index ( RSI ) ? |
| The formula of RSI |
| Calculation of RSI |
| What does RSI tell you? |
| Limitation of RSI |
What is Relative Strength Index ( RSI ) ?
Relative Strength Index ( RSI ) is a technical analysis indicator developed by J. Welles Wilder among others like Average Directional Index (ADX), Average True Range (ATR) and Parabolic SAR.
It is one of the most widely used indicators, after Moving Average.
The objective of the RSI indicator is to measure the change in price momentum.
The textbook ranges for this banded indicator is 70-overbought zone and 30-oversold zone.
However, in practice, the zones are not fixed for all market types.
The formula of RSI:
There are two steps involved in the calculation of RSI:
Step 1:
RSI = 100 – {100/1+ (Average Gain/Average Loss)}
The average gain or loss can be referred to as the average percentage gain or loss during that period.
Usually, 14 periods are used for calculating the initial value of RSI.
This formula for the average losses uses positive values.
The second step for calculating RSI is:
RSI= 100-{100/1+ (Previous average gain13+ Current gain/Average Loss13+Current Loss)}
Calculation of RSI:
After using the above formulas for the calculation of RSI, you can plot the RSI line alongside any asset’s price chart.
This indicator will rise when the number of the positive closing prices will increase and fall when the number of positive closing prices will decrease.
When the market is strongly trending the RSI will be near 0 or 100.
What does RSI tell you?
RSI help us in analyzing the stock in the following ways:
1. Overbought and Oversold:
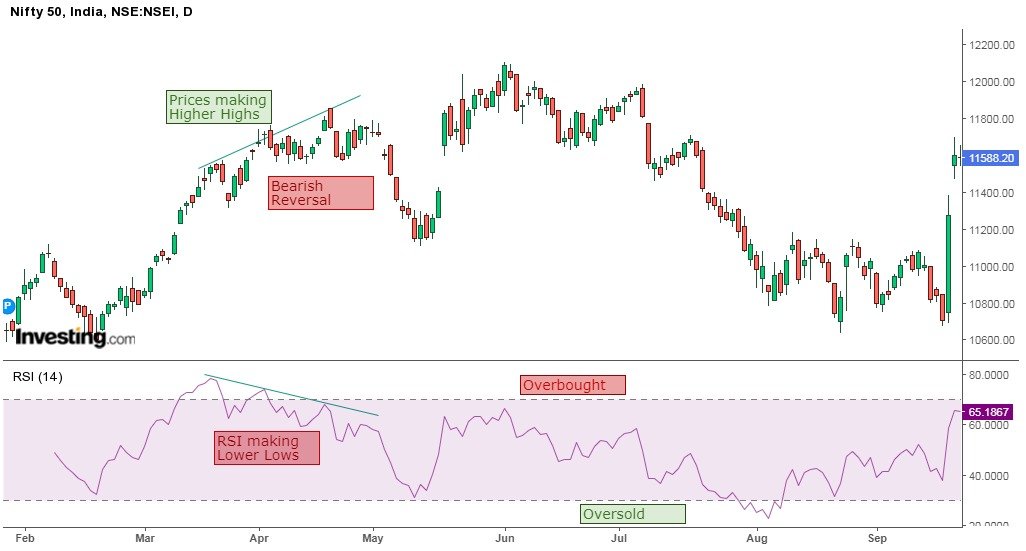
The most important thing RSI tells us whether the stock is overbought or oversold.
Above 70 the stock is considered to be overbought and below 30, the stock is considered to be oversold.
When the stock enters the overbought region, the trader should exit his position and when it enters the oversold region, the trader can enter a buy position.
2. Divergences:
RSI also helps us in spotting bullish and bearish divergences that signal bullish and bearish reversal respectively.
When the prices keep making higher high but the RSI starts making Lower Low, the trader should become cautious as the indicator is signaling a bearish reversal.
This means that the prices make reverse from bullish to bearish.
Learn about 3 Powerful Use of RSI in 2 hours by Market Experts
Similarly, when the prices keep making Lower Low but the RSI starts making Higher High, then the trader should become cautious the indicator is signaling a bullish reversal.
This means that the prices make reverse from bearish to bullish.

Limitation of RSI:
Like most technical indicators, RSI indicator signals are most reliable when they confirm the long-term trend but sometimes it may also generate a false sign.
Thus the signal generated by RSI should be confirmed with other technical indicators and price actions.
When the market is trending, RSI can stay in overbought or oversold territory for long periods of time.
Thus, the RSI is most trustworthy in an oscillating market when the price is shifting between bullish and bearish periods.
Also, for traders who are unable to devote time in studying charts of all the securities, the scan section in the StockEdge mobile app, now also available in the web version, provides an easier way to track certain trade opportunities based on RSI absolute level or movement of RSI index.
The app provides an opportunity to club RSI strategy with other indicators, volume, and price patterns base strategies on EOD basis.
Tell us which is your favorite indicator writing in the comment box below.
You can also join our RSI trading course to enhance your knowledge further.
Happy Learning!!


Sir, It’s informative.
Please guide me for Intraday.
I’m a beginner.