Shooting Star Candlestick Pattern- What is the first thing that comes to your mind when you read the term “Shooting Star”?
Isn’t a star falling close to the earth’s surface?
But how is it related to Technical Analysis?
Well, a shooting star is a bearish candlestick pattern having a long upper shadow and no lower shadow at all.
Let us discuss this bearish reversal candlestick pattern in detail:
What is the Shooting Star Pattern?
A shooting star is a type of candlestick pattern that forms when the price of the security opens, rises significantly but then closes near the open price.
The distance between the highest price of the day and the opening price should be more than twice as large as the shooting star’s body.
It occurs at the end of the uptrend and signals a bearish reversal.
Formation of Shooting Star
Here is the formation of the shooting star candlestick pattern:
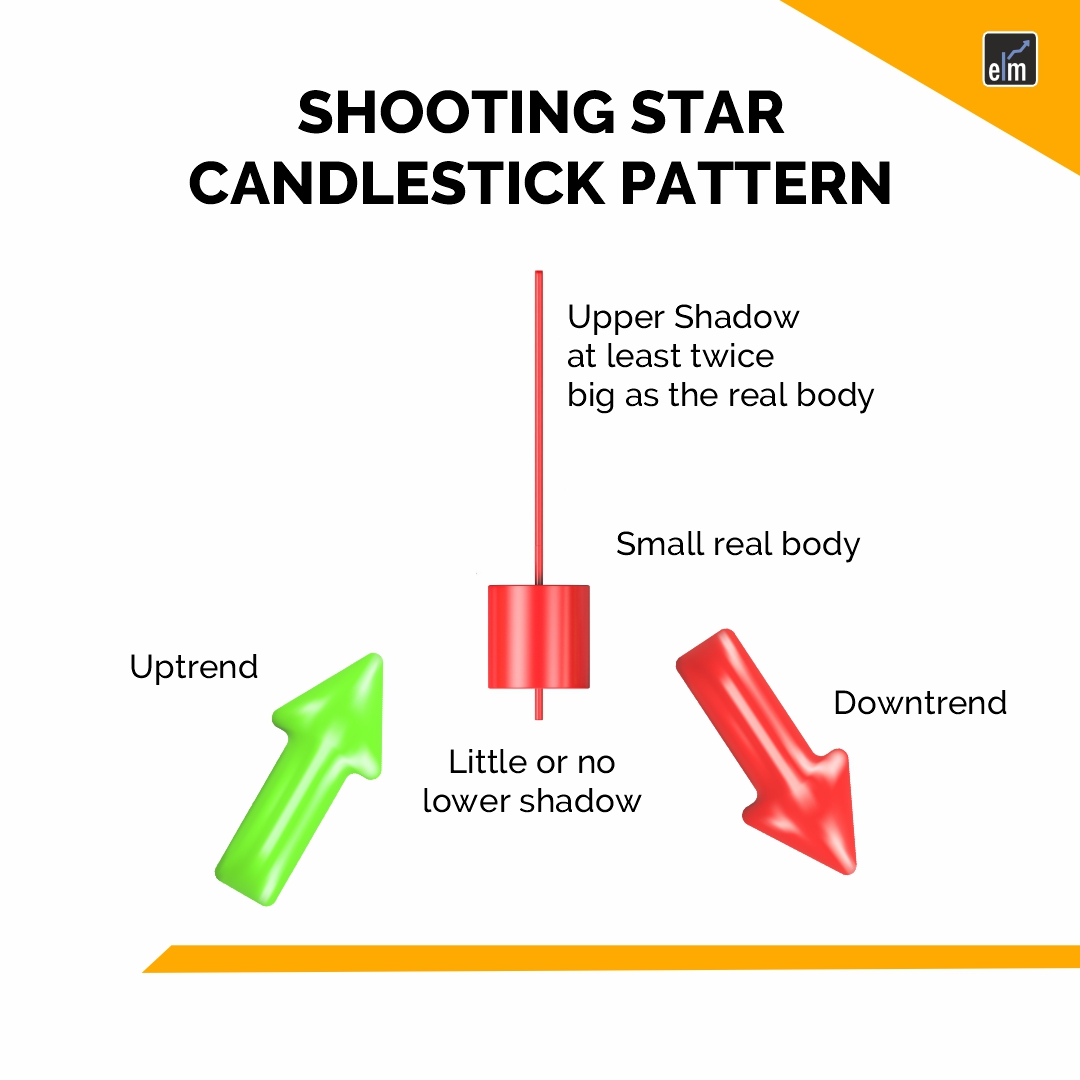
What does Shooting Star tell you?
Shooting stars signals a potential downside reversal and is most effective when it forms after 2-3 consecutive rising candles having higher highs. A shooting star opens and rises strongly during the trading session, showing the same buying pressure that is seen over the last trading sessions.
At the end of the trading session, the sellers push the price down near the open. This shows that the buyers have lost control by the end of the day, and the sellers have taken over.
The long upper shadow indicates that the buyers are losing position as the price drops back to the open. The candle after the shooting star gaps down and then moves lower on heavy volume. This candle helps in confirming the price reversal and indicates that the price will continue to fall.
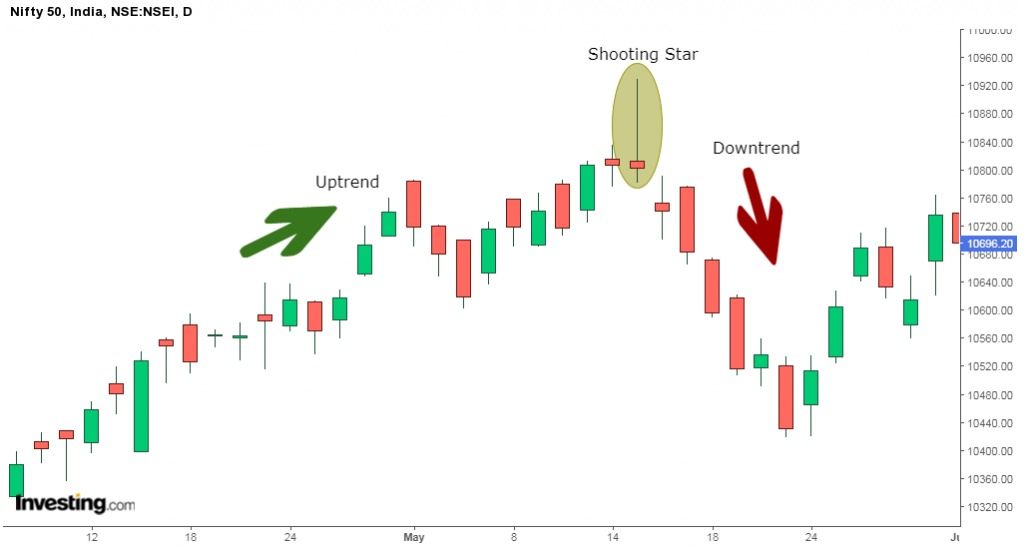
Trading Example
Before trading with the shooting star, one should remember the following points:
- Trade Entry: Before you enter a shooting star trade, you should confirm that the prior trend is an active bullish trend.
- Stop Loss: You should always try to use a stop-loss order when trading the shooting star candle pattern.
- Taking Profits: The price target for this trade should be equal to the size of the shooting star pattern.
Below is an example of the shooting star candlestick pattern in the daily chart of Nifty. We can see how the shooting star is formed after a strong uptrend and signals a bearish reversal.
Difference between Shooting Star and Inverted Hammer
The inverted hammer and the shooting star look almost the same but they have a difference
A shooting star occurs when the price moves up and then the prices fall. Whereas an inverted hammer candlestick occurs after a price falls and it rises.
How to use Shooting Star Candlestick Scans in StockEdge?
You can also use the Shooting Star scans in StockEdge web version
Steps to use Shooting Star Candlestick scans in StockEdge:
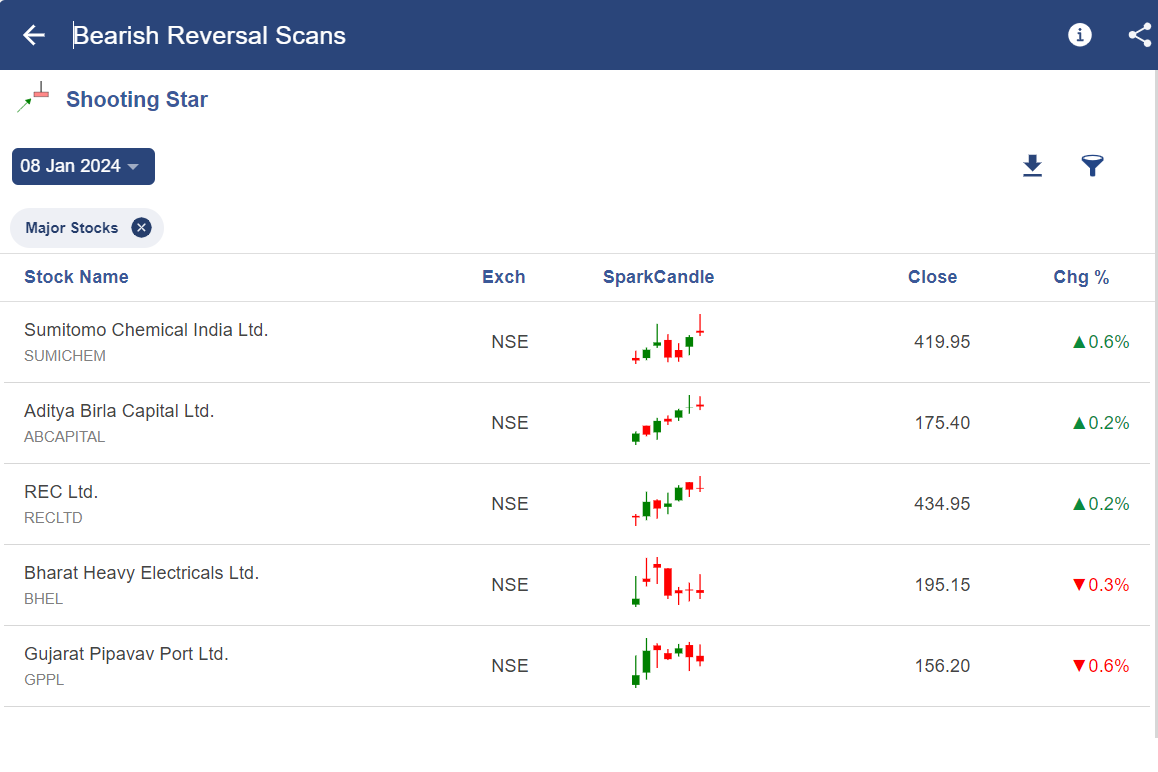
- Under the “Candlestick Scans” we can see Bearish Reversal scans as shown below:
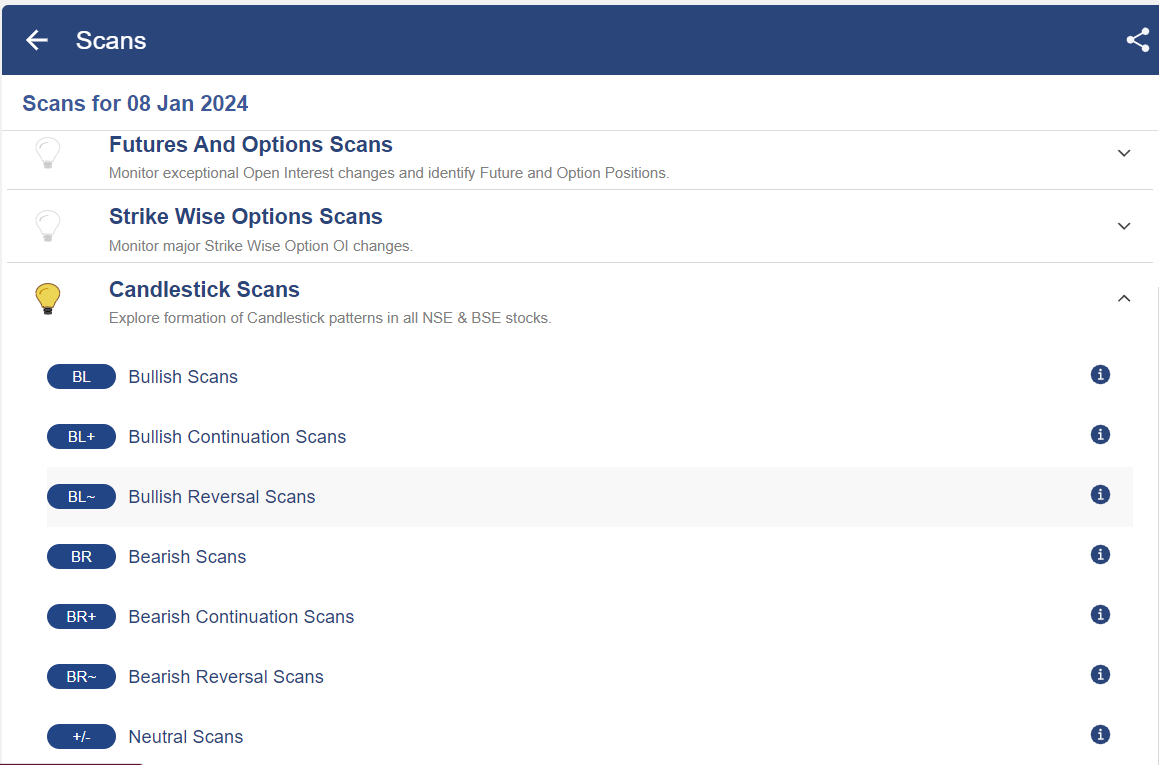
- When we click on the “Bearish Reversal scans” we can see the “Shooting Star” scan, click on that:

- After selecting on it, you will get a list of stocks in which “Shooting Star” pattern is formed as shown below:
Limitations of Shooting Star
One should not only rely on a candle pattern like in a shooting star for making trading decisions.
This is why confirmation is required, one can confirm by the next day candle or other technical analysis indicators.
One should also use stop losses when using candlesticks to control the losses.
A candlestick pattern is more significant when it occurs near an important level, signalled by other forms of technical analysis.
Read More- All 35 Candlestick Chart Patterns in the Stock Market
Bottomline
A shooting star is a type of candlestick pattern that forms when the price of the security opens, rises significantly but then closes near the open price. A shooting star is a bearish candlestick pattern having a long upper shadow and no lower shadow at all. There is a difference between a shooting star and an inverted hammer. One should not only rely on a candle pattern like in a shooting star for making trading decisions.
Frequently Asked Questions (FAQs)
Is shooting star a bullish candle?
A bearish candlestick with a long upper shadow, little to no lower shadow, and a small real body close to the day’s low is known as a shooting star. After an upward trend, it emerges.
What is the opposite of a shooting star candle?
Shooting star patterns occur after a stock uptrend, illustrating an upper shadow. Essentially the opposite of a hammer candlestick, the shooting star rises after opening but closes roughly at the same level of the trading period.
What is the difference between shooting star and evening star?
The patterns of the shooting star and evening star are nearly identical. Following a large price move, both candlestick patterns are bearish reversals. Of the three candlestick patterns, the second candlestick is the only one that differs between the two patterns.


