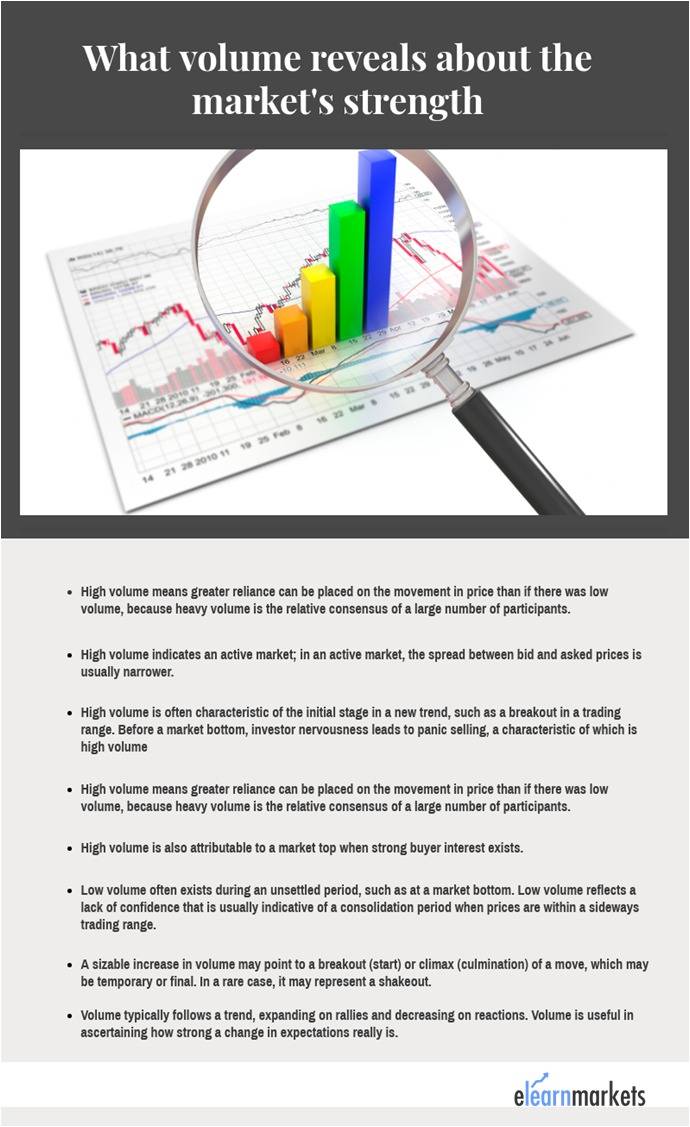
One of the most overlooked technical parameters is Volume in trading especially by beginners, but as this is the most worthwhile technical parameter you should try to get to grips with this metric and to include it in your preparation.
Knowing what other investors are trading is important for understanding what stocks are in play and which are likely to make big moves.
Volume is one of the simple tool that works and help in identifying these big moves.
As with most indicators, volume also works with other indicators. As a beginner it is crucial to know what volume is, why it is important in stocks and how best to can use it.
| Table of Contents |
|---|
| What is Volume? |
| Basic Guidelines for using Volume |
| Why Volume in Trading is Important? |
| Volume Indicators |
| Key Takeaways |
What is Volume?
Volume is basically the total number of buyers and sellers exchanging shares over a particular period of time usually a day.
The share is more active when the volume is high.
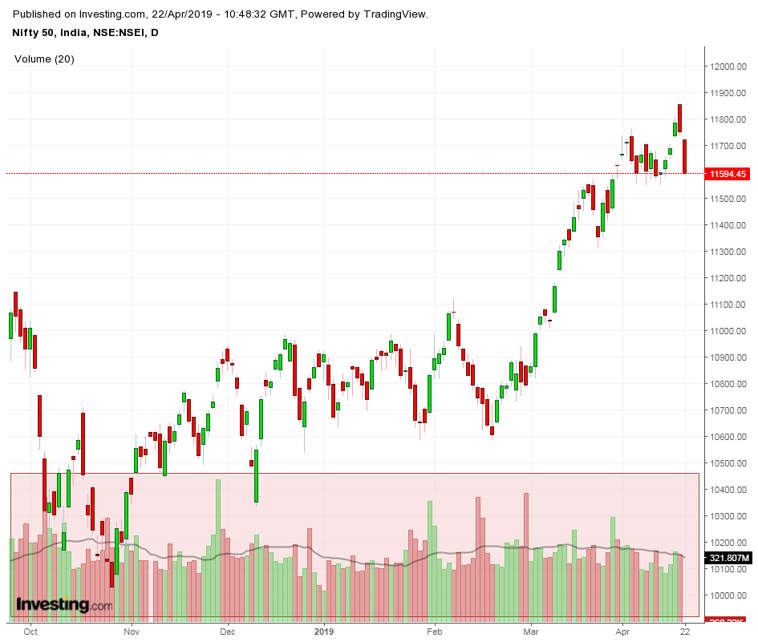
The data on volume of a share is readily available on the charts or the trading screen. Most financial sites have data on volume,
For Example:
If the volume of the stock for the day was 1,500,000 shares which mean that 1,500,000 shares were sold by someone and someone bought those shares on that day.
Volume may not be an attractive piece of information but you should try to combine the volume data with resistance and support levels to get a clear picture.
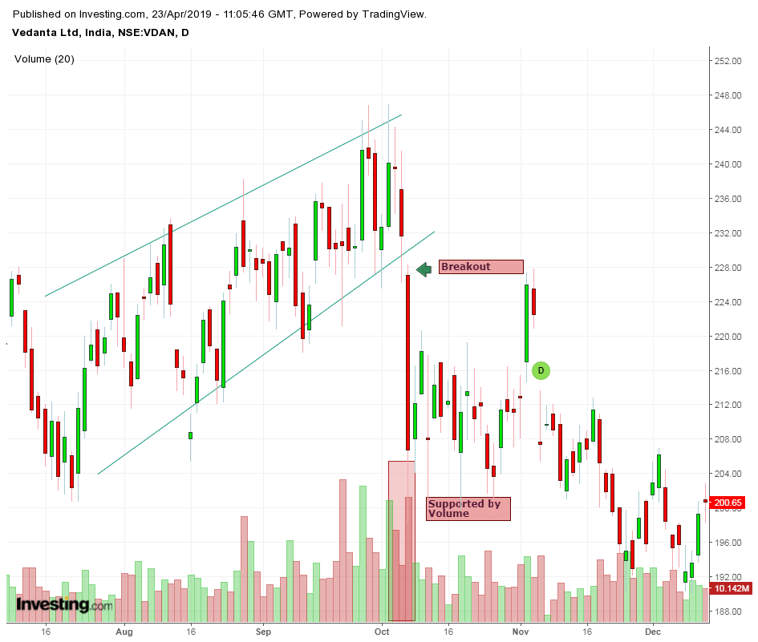
For example: Say stock A ltd. broke a resistance level and went further. But if the stock has broken the resistance with volume then it may move further up.
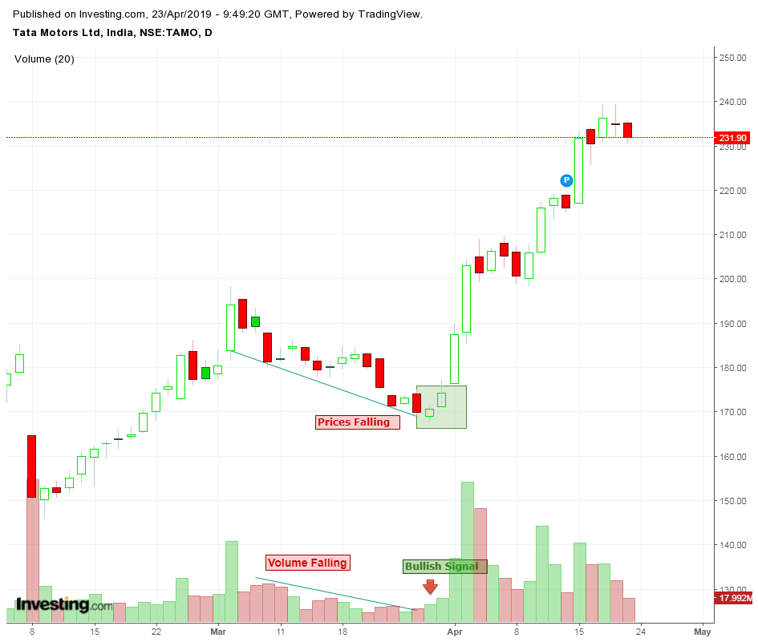
Let us consider that the volume traded on that day the total number of shares exchanged were 3 lakh. Say on a normal day 10 lakh shares are traded. This means the volume was below the average for that particular day.
Also Read : Difference between Volume Traded and Volume Delivery
It means that all the big investors were not trading and decided to be bearish on the stock. They sell the stock which causes panic. The very next day the stock goes down.
This is the importance of “volume”. Traders do not buy the stock unless it breaks a critical level and unless the volume is high. If the stock goes down with little then it also means the same thing.
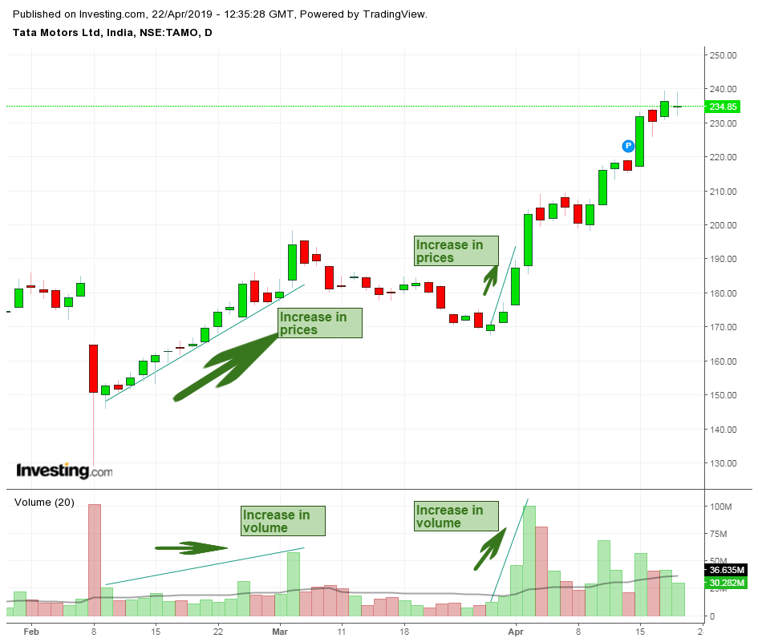
So any break of critical support and resistance level is not valid unless there is high volume. Volume should move along with the trend. If prices are in an uptrend then volume should increase along with the trend
Basic Guidelines for using Volume:
When we analyze volume in trading there are some guidelines which we can use to determine the weakness or strengths of a move. The below guidelines are not true in all the situations but they help in trading decisions:
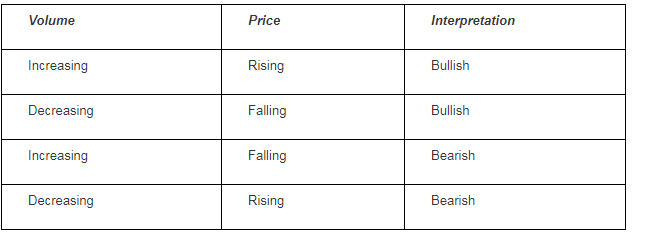
1. Volume and Market Interest :
A rising market should have rising volume. Buyers should be increasing to keep the prices moving high.
Increasing price and decreasing volume is a warning for a potential reversal. Price rise or decrease on little volume is not a strong signal whereas a price rise or decrease on large volume is a strong signal.
2. Volume and Reversals:
Volume plays an important role in identifying reversals signs. When the volume decreases and prices are also falling then it generates a bullish signal and similarly when the volume decreases when the prices are rising then it indicates bearish signals.
3. Breakouts vs False Breakouts
On the initial breakout from the range or chart pattern, a rise in the volume indicates strength in the move. Little change or decline in volume on a breakout indicates a false breakout.
Why Volume in Trading is Important?
As discussed above volume is used by technical analysts to confirm trends and chart patterns. The strength of any price movement is measured mainly by volume.
1. Volume and Chart Patterns:
Volume plays a major role when confirming chart patterns, like triangles, head and shoulders, flags, etc. If the volume isn’t present with these chart patterns then the trading signal isn’t that reliable.
2. Volume precedes price:
Technical Analysts closely analyze the volume to see when reversals are about to occur. If the volume is decreasing in an uptrend then it can signal that reversal may take place soon.
Volume Indicators:
Volume Indicators are mathematical formulas that are visually represented charts. There are many volume indicators. Let us discuss them:
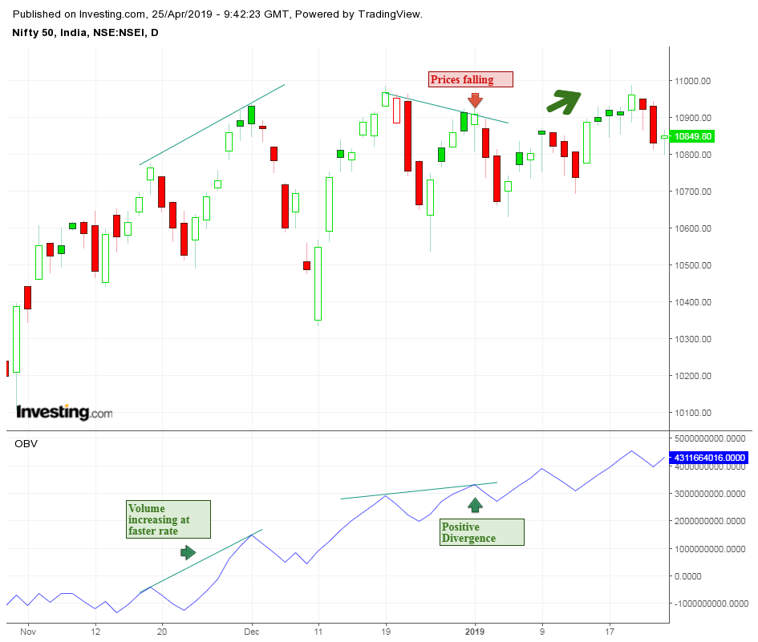
1. On-Balance Volume:
On-Balance Volume (OBV) is a simple volume indicator. In this On-Balance Volume indicator volume is added when the market finishes higher and subtracted when the market finishes lower. This indicator can also divergences like when the prices rise and volume is increasing at a lower rate or falling.
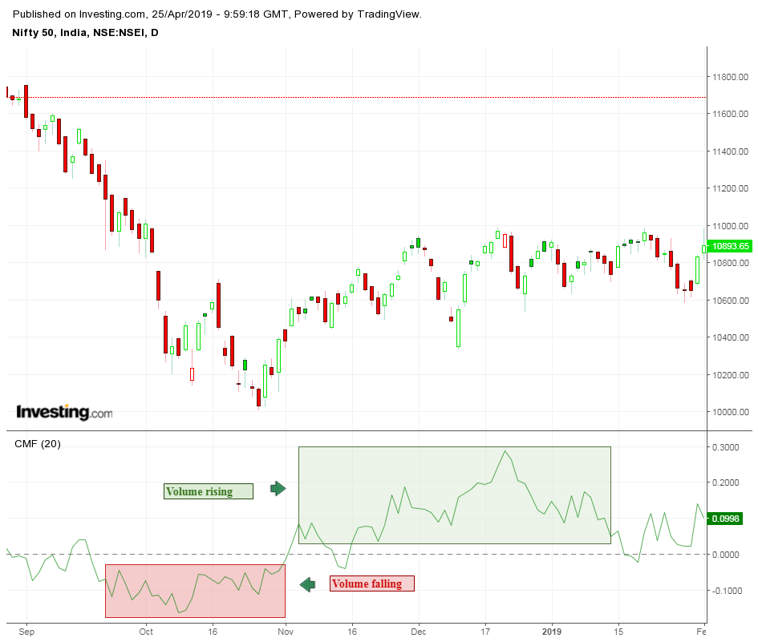
2. Chaikin Money Flow:
An increase in prices should be accompanied by rising volume, therefore the formula of this indicator focuses on expanding volume when price closes in the upper or lower portion of their daily range and provides value for the corresponding strength.
When the price closes in the upper portion of the range and volume are increasing then the values will be high and when prices are in the lower portion of the range then the volume will be negative.
Key Takeaways:
- If the trend is bullish with heavy volume then new high may occur. A new high on light volume is temporary.
- A new low price with high volume is a bearish indicator and a new low with less volume is less significant.
- A rally to a new price high on increasing volume but with less activity than the previous rally is questionable. It may indicate a reversal in trend.
- A rally on decreasing volume in trading is questionable. It may indicate price reversal.
In order to get the latest updates on Financial markets visit Stockedge.


Nice
Hi Prasad,
Thank you for reading.
You can read more technical blogs here.
Keep Reading!
Thanks for sharing such useful information.
Hi,
Thank you for Reading!
Keep Reading!
Wonderful job done by Elearnmarkets….. Please keep doing and sharing knowledge to new bee in market. God bless complete team and founder too.
Hi,
Thank you for Reading!
Keep Reading!