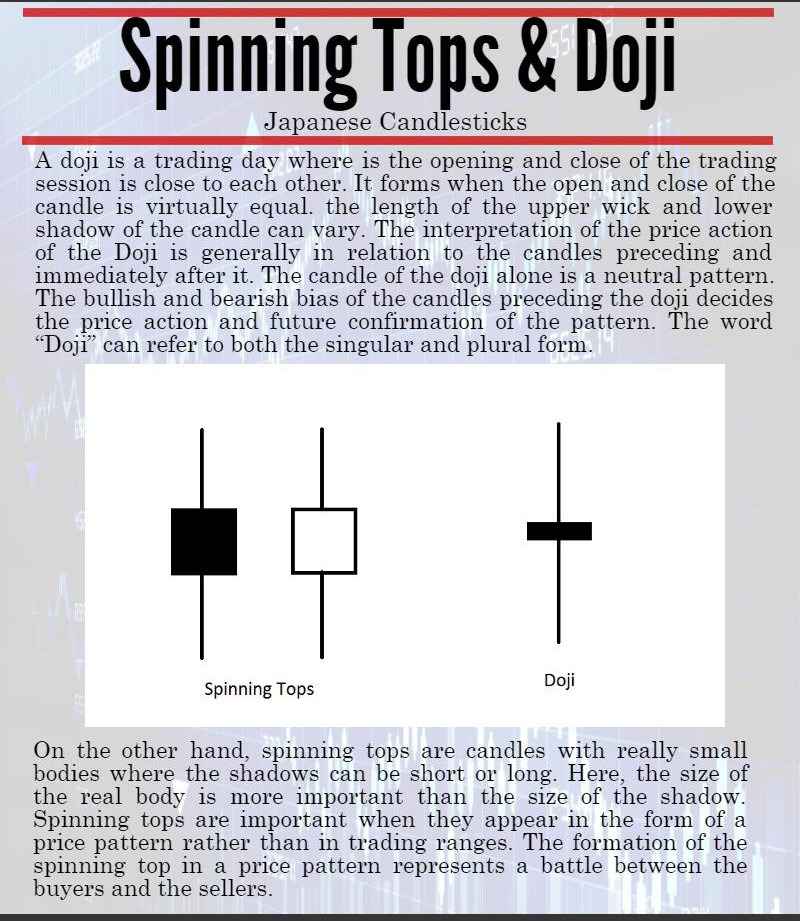
A doji is a trading day where the opening and close of the trading session is close to each other. It forms when the open and close of the candle is virtually equal.
The length of the upper wick and lower shadow of the candle can vary.
Also Read: Meet the Doji (s): Dragonfly and Gravestone
The interpretation of the price action of the Doji is generally in relation to the candles preceding it and immediately after it.
Know More: All you need to know about the Japanese Candlestick
The candle of the doji alone is a neutral pattern.
The bullish and bearish bias of the candles preceding the doji decides the price action and future confirmation of the pattern.
The word “Doji” can refer to both the singular and plural form.
Learn Technical Analysis from scratch by enrolling in: NSE Academy Certified Technical Analysis course on Elearnmarkets.
Since the pattern of the Doji shows that the opening and closing of the trading session to be very close to each other, we can say that it represents a period of indecision.
When doji patterns appear in trading ranges, they show that the buyers and sellers of that particular stock are in balance and therefore are of little significance.
However, when the Doji appears after an advance or a decline, it shows that the buyers or sellers are now confused about the continuation of the trend and there is an impending reversal expected in the trend.
On the other hand, spinning tops are candles with really small bodies where the shadows can be short or long.
Here, the size of the real body is more important than the size of the shadow.
Spinning tops are important when they appear in the form of a price pattern rather than in trading ranges.
The formation of the spinning top in a price pattern represents a battle between the buyers and the sellers.
Spinning tops can be regarded as the opposites of a long real body in the sense that long bodies like the Marubozu represent the decisiveness of the market participants.
But in the case of a spinning top, it shows the indecisiveness of the markets i.e. the market participants cannot decide whether the prices should rally or decline.
Just like in the case of doji, when the spinning tops appear after a prolonged period of rally or reaction, they are a sign that the upside or the downside momentum is slowing down.
In simple words, it can be said that in the previous sessions, the buyers or sellers were having the upper hand but the appearance of the spinning top tells us that the fight is now more evenly matched.
So, a small change in the balance between the demand and supply can reverse the price trend the other way.
This is further confirmed when the candles immediately succeeding the spinning top shows continuation or reversal implications.
Some recent formations of spinning tops can be seen in the following examples: –
Nifty:
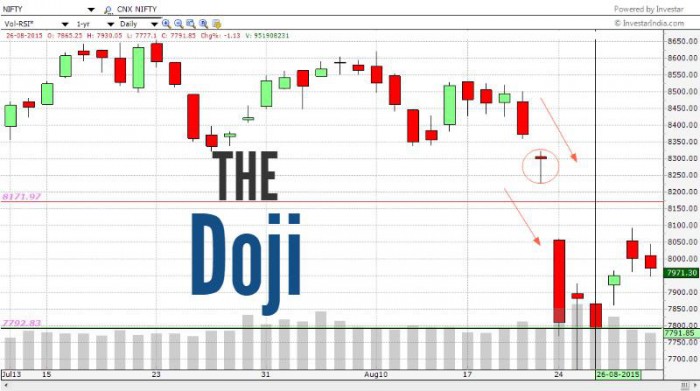
On 21.08.2015 the Nifty opened at 8305, fell as low as 8225, made a high of 8322 and finally closed at 8299.
Here we can see that even though the range between the high and low is about 97 points, the difference between the open and the close is only 6 points.
Thus this led to the formation of a perfect doji formation.
But, in reality it was a Doji failure.
As the pattern appeared after a trading range, the market sentiment was perceived as indecisive whether the support of the trading range will be held or not.
But the gap down of the market the next day broke the support and led to further downfall.
Zee Entertainment Limited
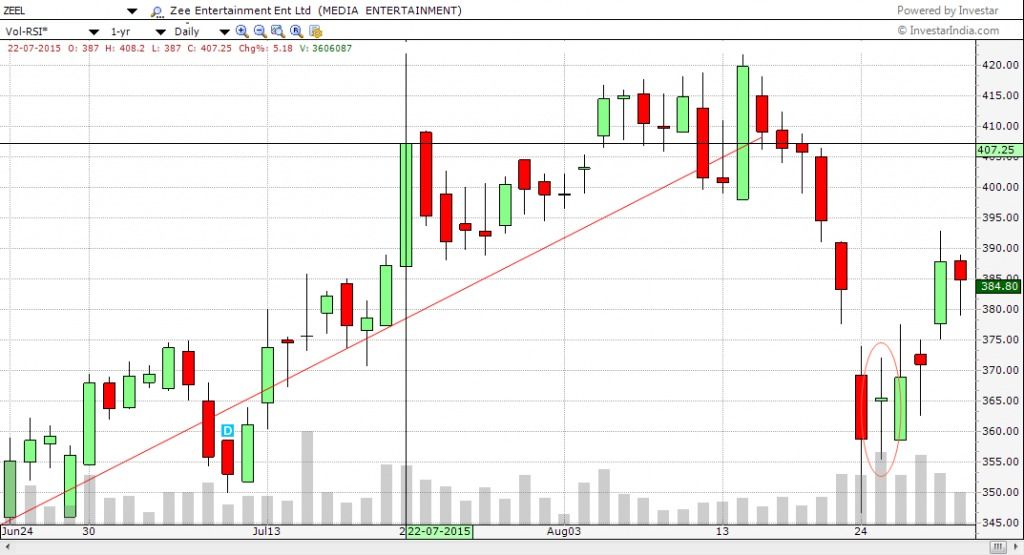
On 25.08.2015, after a series of huge downfall, a doji appeared in the daily chart of ZEEL
The doji presented the indecision in the minds of the sellers who have been shorting the stock for a couple of sessions. The high volume along with the doji further confirmed the indecisiveness.
This was followed by a reversal in the trend of the chart.
Bottomline:
We hope that the above write-up has helped you to get a clear idea of Dojis.
Feel free to share your feedback by writing to us in the comment box below.
In order to get the latest updates on Financial Markets visit https://stockedge.com/


