The Stochastic Indicator, developed by George C. Lane in the late 1950’s is one of the most popular members of the Oscillator family in technical analysis.
It is a leading indicator as it gives us advanced signals before it is reflected in the price behaviour.
In an interview, George Lane said that Stochastic doesn’t follow any price or volume; rather it follows the speed of price momentum and as a general rule, the momentum changes direction before the price changes.
| Table of Contents |
|---|
| Stochastic Indicator |
| Stochastic Indicator Formula |
| Interpretation |
| Slow vs Fast Stochastic Indicator |
| Bullish and Bearish Divergence |
| Utility in Multiple Time Frames |
| Bottomline |
Stochastic Indicator
The Stochastic Indicator is a momentum based indicator which identifies the location of the present closing price relative to its range over a set number of periods.
The major takeaways from Stochastic include overbought and oversold zone, bullish and bearish divergences (which help in anticipating future reversals) and crossovers.
The Stochastic Indicator is referred to as oscillators since it oscillates between zero and hundred.
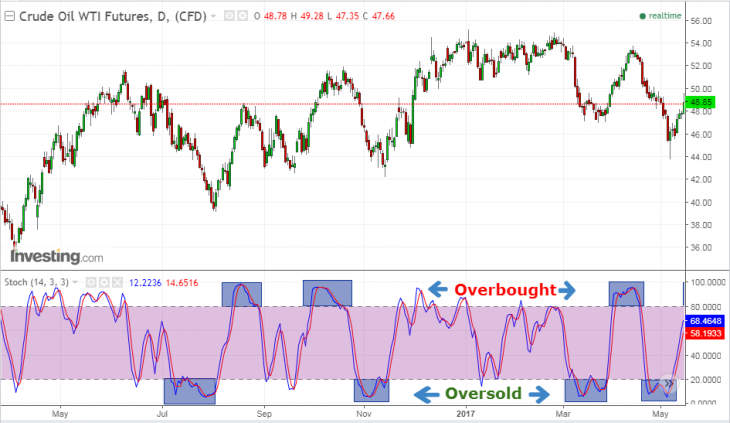
In the indicator, you will find two lines drawn at 20 and 80 levels as a warning signal.
Say if the value crosses 80, it is identified as overbought zone and it’s time to be little cautious on fresh long.
When Stochastic goes below 80 from the overbought zone, it is considered as a bearish signal.
On the other hand, if it goes below 20, it is interpreted as oversold zone and a buy signal is generated once it crosses above 20.
Learn from Experts : Technical Trading Strategies with ROC Indicator
However, a Stochastic can remain in the overbought zone for an extended period of time, while the financial instrument can keep on making newer highs and vice versa for the oversold scenario.
Stochastic Indicator Formula
It is calculated using the following formula-
%K = 100[(C – L14) / (H14 – L14)]
Where,
C = the recent closing price
H14 = the highest price traded during the same 14-day period.
L14 = the low of the 14 previous trading sessions
Interpretation
A %K of 80 implies that the security’s price is above 80% of the price range (high – low) of last 14 days. The assumption here is that security’s price will remain at the top of the range in a strong uptrend.
The other line i.e. %D line which is a three-period moving average of the %K line which acts as a signal line.
Whenever the %K line crosses the %D line, it generates a trading signal.
Normally a period of 14 days is used for the above calculation, but the traders often modify it to 5 or 9 according to their trading strategies.
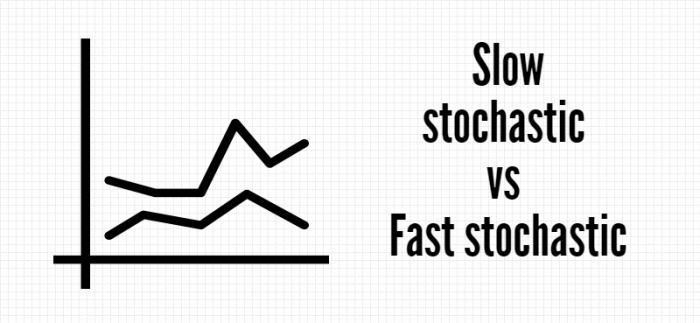
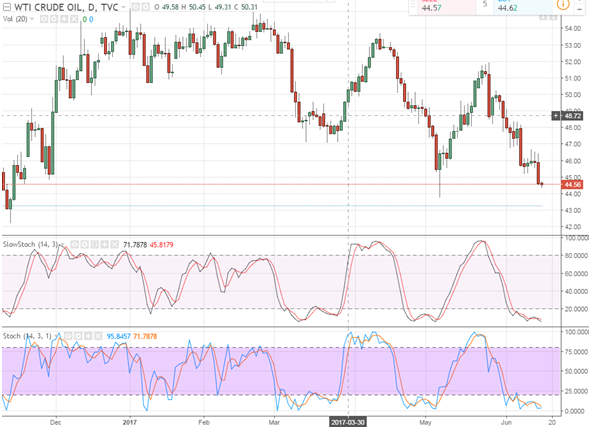
Slow vs Fast Stochastic Indicator
There is a concept of fast and slow stochastic and the difference basically lies in terms of sensitivity.
The % D line in fast Stochastic is 3 period moving average of %K line.
This % D line of fast Stochastic is taken as % K line of slow Stochastic, the %D line in slow Stochastic is 3 period moving average of this line.
The fast Stochastic is more sensitive than the slow Stochastic to a change in the price of the underlying security and it will result in more number of trading signals than slow Stochastic.
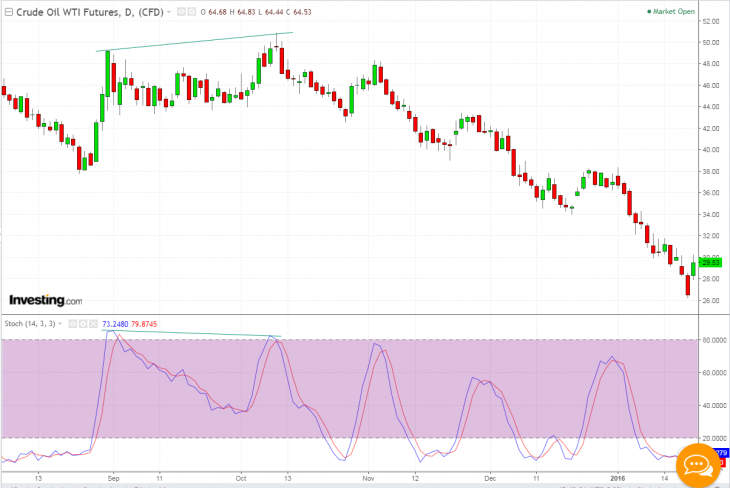
In the following picture, we have plotted both the slow and fast Stochastic for WTI Crude oil.
Bullish and Bearish Divergence
Apart from identifying overbought and oversold zone, another very important use of Stochastic Oscillator is divergence and it plays a very important role in identifying reversals.
A bullish divergence is seen when the price makes a lower low while stochastic makes a higher low.
This shows that the downside momentum is weakening and anytime there can be a reversal on the upside.
A bullish divergence is confirmed when the price action becomes bullish along with stochastic continuing uptrend.
On the other hand, a bearish divergence is formed when the price makes a higher high but the stochastic makes a lower high.
It suggests that the upside momentum is limited and anytime there could be a reversal on the downside. The confirmation of bearish divergence comes when the price action becomes bearish and stochastic continue downtrend.
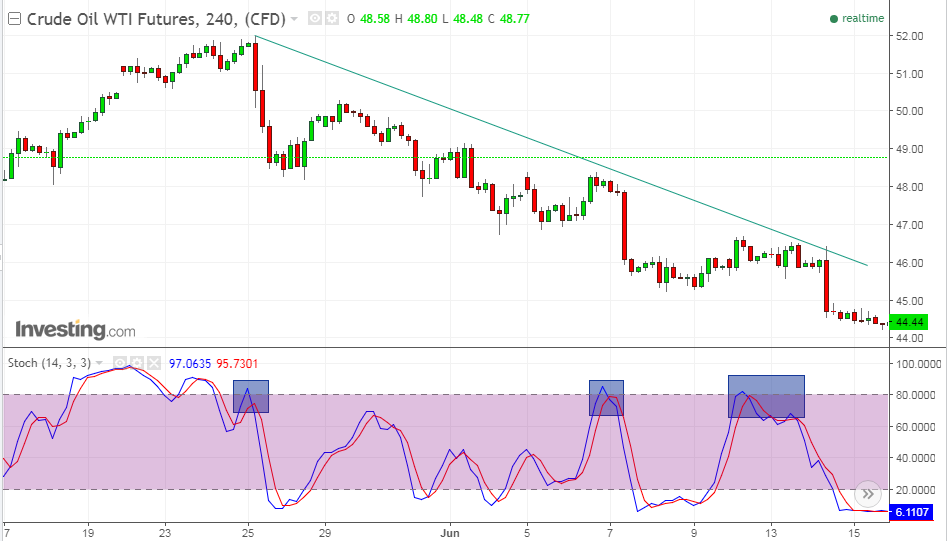
Utility in Multiple Time Frames:
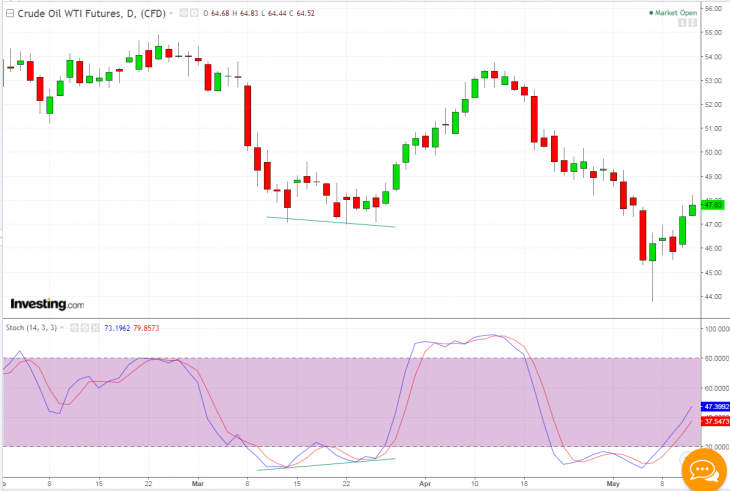
The Stochastic Oscillator can be better analysed in the multiple time frame as it will provide better and relatively earlier confirmation.
Say if you are analysing Stochastic in the daily chart, you need to look into the smaller time frame say hourly or 4 hourly in order to get early entry into the trades.
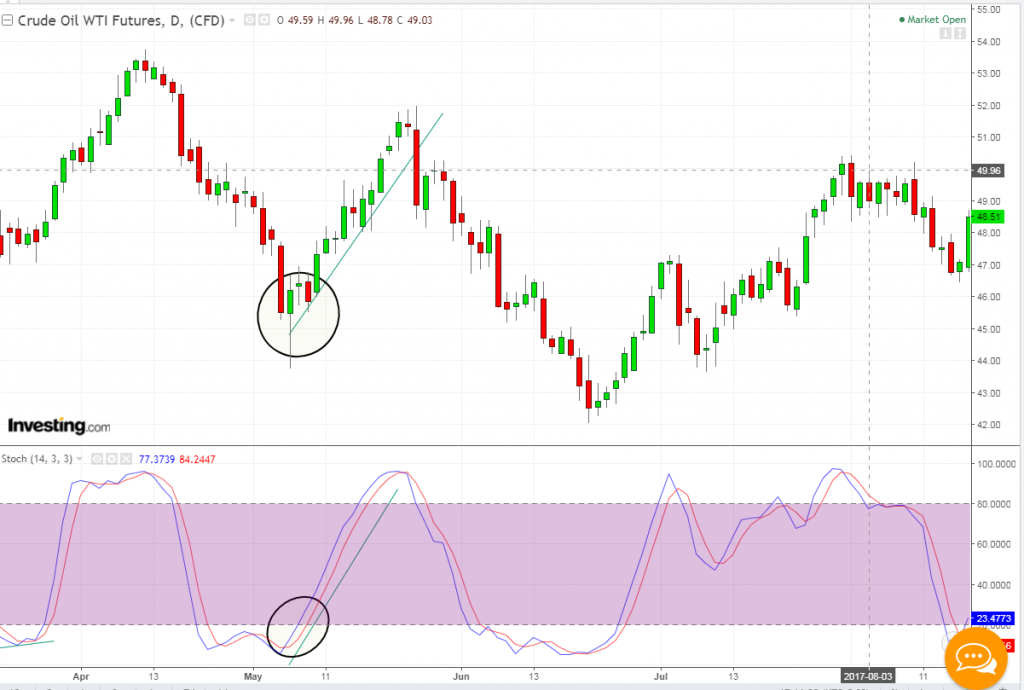
Let’s look at crude oil chart-
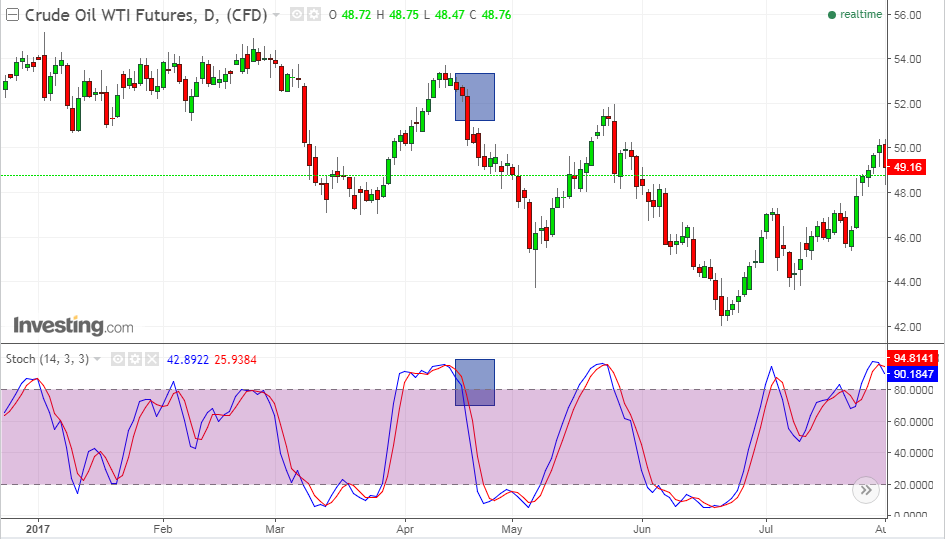
This is the daily chart of WTI Crude and if we look into the price chart, the fall in the price was clearly indicated by the fall in Stochastic below 80 line and it has given a descent 8$ move since then.
However, using the signal from daily chart, we would have missed early part of the move given by the candle as circled in the figure.
In order to avoid it, we should have looked into the smaller time frame to get into the trade early.
Let’s look at the 4 hourly chart to gain more clarity on this.
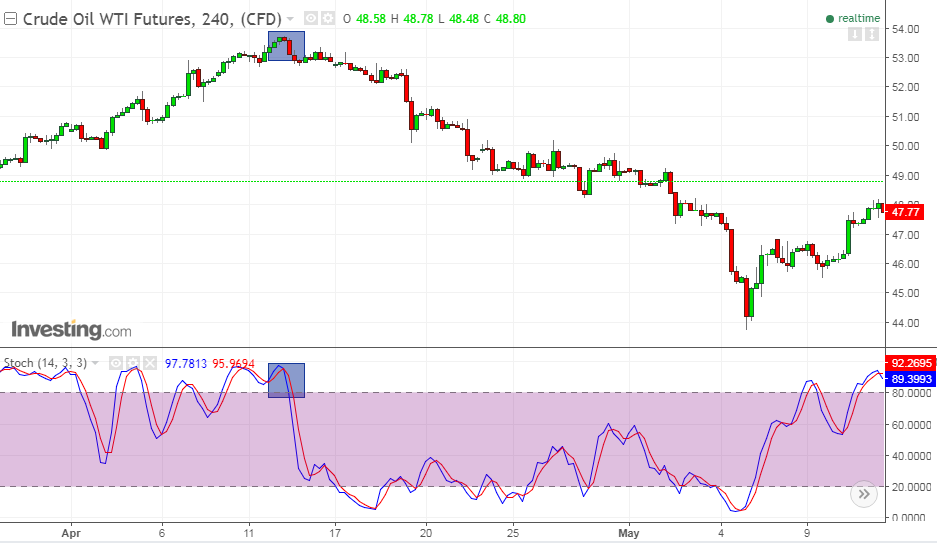
As you can see in the above 4 hourly chart, the Stochastic has given the sell signal quite before than it was evident in the daily chart.
Hence, it’s important to look into the smaller time frames to maximise your gains and get into the trades early.
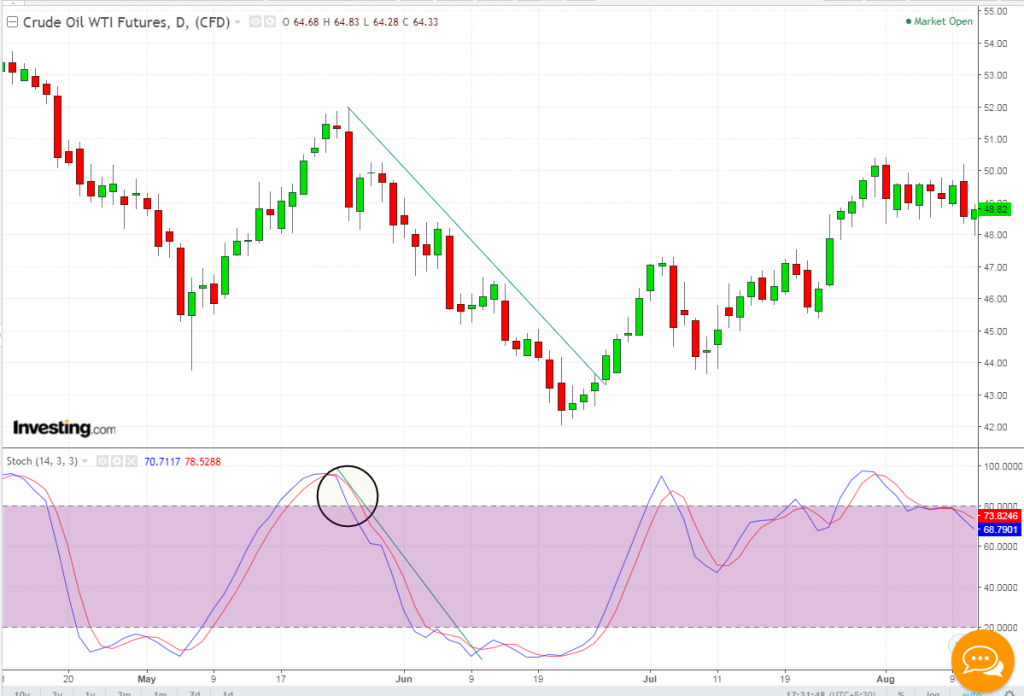
Also, let us look at the daily chart of crude oil again (chart above).
Once the Stochastic Indicator has gone below 80 from the overbought zone, and keep on trending lower, a trader will not be able to go back in time and sell in past.
But, in the next chart (chart above) with a lower time frame (4 hourly in this case) the trader could spot low-risk entries, based on lower time frame Stochastic.
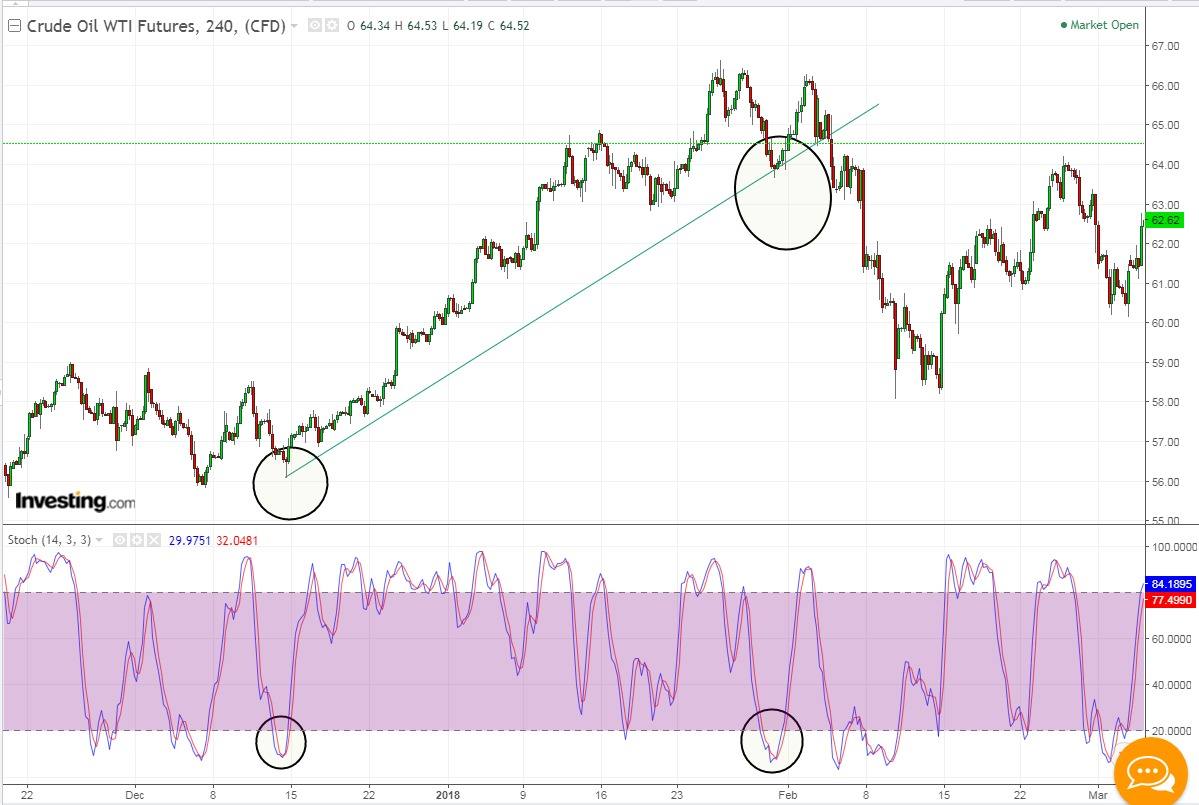
Similarly for an uptrend, in the daily chart below we can see, Stochastic moving up in a trend.
While 4 hourly chart shows how low-risk entries could be spotted on the basis of lower time frame Stochastic.
Bottomline
The momentum oscillators work very well in the trading market but it can be used in the trending market as well.
Many times the Stochastic Indicator gives a crossover before reaching the 20 or 80 line and this crossover in the middle is strong confirmation of a change in short-term trend.
The accuracy of its findings makes it a favourite indicator amongst the technicians.
It is looked upon by both new technicians as well as by the seasoned professionals as it helps in making good entry and exit decisions.
Check Stockedge to get latest scans and updates on Financial Markets.


