Business Models – Example, Types, Importance & Advantages
April 12, 2024
How to Withdraw Money from ATM ?
April 1, 2024
9 Types of Volume Indicators a trader should know
March 13, 2024
5 MACD Strategies For Stock Market Trading
April 24, 2024
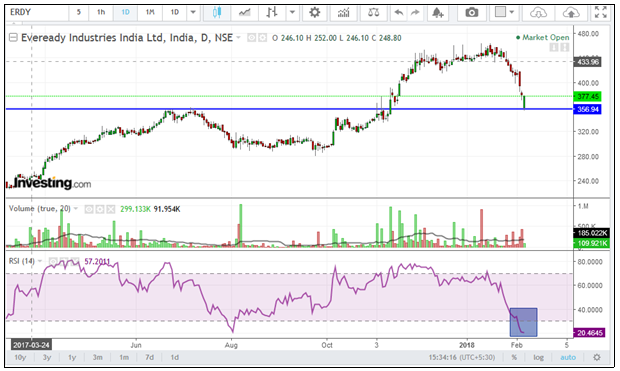
Fig: Eveready chart EVEREADY at support and RSI oversold. ( not a reco to buy/sell/ hold) Fig: bank of Baroda chart BANK OF BARODA at support STOCHASTIC oversold and positive crossover below 20. ( not a reco to buy/sell/ hold) Fig: TTK Prestige chart TTK PRESTIGE at support MFI above 50 level and RSI oversold. ( not a reco to buy/sell/ hold) Fig: TVS Motor chart TVS MOTOR at support MFI and RSI both oversold. ( not a reco to buy/sell/ hold)
Allcargo Logisticsat support with rising CCI. ( not a reco to buy/sell/ hold) TCS stuck in channel and RSI coming down from over bought level. ( not a reco to buy/sell/ hold) INDIAN BANK near support and STOCHASTIC oversold. ( not a reco to buy/sell/ hold) United Breweries near 52 week high with rising volume. ( not a reco to buy/sell/ hold)
SIEMENS forming channel with rising RSI. ( not a reco to buy/sell/ hold) BPCL broke channel and MACD above signal line. ( not a reco to buy/sell/ hold) NHPC at support level and STOCHASTIC over sold. ( not a reco to buy/sell/ hold) BRITANNIA stuck in channel with rising MACD. ( not a reco to buy/sell/ hold)
Macd bullish divergence on Bharti Infratel. ( not a reco to buy/sell/ hold) Tata motors on swing low support with Stochastic oversold. ( not a reco to buy/sell/ hold) Himatsingka seide above 200 sma and rsi oversold. ( not a reco to buy/sell/ hold) CESC on support area with Stochastic over sold. ( not a reco to buy/sell/ hold)
Bharti Airtel near his support and rsi oversold. ( not a reco to buy/sell/ hold). BPCL near his support and positive crossover on MACD. ( not a reco to buy/sell/ hold). ICICI Bank coming out from his over bought zone RSI break 70 level downward. ( not a reco to buy/sell/ hold) Ambuja cement on previous swing low support. ( not a reco to buy/sell/ hold)
Maruti Suzuki , daily candle forms outside triangular consolidation with increase in volume ( not a reco to buy/sell/ hold). Gillette India at the edge of consolidation with volume dying down substantially in last few days ( not a reco to buy/sell/ hold). Shakti Pumps broke its previous swing high with increase in volume ( not a reco to buy/sell/ hold). Sun Pharma Trading in narrow range, above previous swing high for last two weeks ( not a...
Chart Patterns are many but out of all the chart pattern, we are going to show you some of the most Important Chart Pattern that can be used by Technical Analysts & Fundamental Analysts. The two primary method to analyse...
A Flag Pattern may be formed after a downtrend or an uptrend. Also Read: A complete overview on trend and theory of retracement It is a measuring move, as it occurs somewhere near the middle of the trend. Post the formation...
LICHSFIN DAILY CHART, SHOWING VOLUMES Volume plays a very important role in determining the actual 'mood' of a security. The process of accumulation and distribution are extremely important in identifying the tops and bottoms, be it in case of an...
Larson and Toubro ( LT ) lost nearly 45% from the top of 1880 formed back in July 2015. Currently it is consolidating near an important level of 1100. Since mid-January 2016 , it has been taking support at the level of...
A symmetrical triangle is a technical chart pattern which is formed in bounds of two converging lines. It shoots high or low, depending on the direction of the breakout. If we look at the chart of Kaveri Seed Company Limites...
Bank of Baroda announced its 3rd quarter results on the 13th of Feb, for FY 15-16. The results were the worst one posted by any bank so far. However, when the trades opened today, Bank of Baroda was seen trading...
Create your free Elearnmarkets account and
Get 20% off with code WELCOME
on your first purchase of any course or webinar