How To Implement Factor Investing Strategies in Your Portfolio
Unlock portfolio potential with factor investing strategies: Learn tactics for optimal diversification and returns
Unlock portfolio potential with factor investing strategies: Learn tactics for optimal diversification and returns
In this article, we will discuss the moving average indicator. The indicator not only helps a trader to understand the market situation but also helps to make better trading decisions.
Discover Renko chart strategies that can help you achieve success in your trading endeavors. Start using these strategies today!

Want to take your trading to the next level? Discover the benefits of Renko charts and how to use them to make better trading decisions.
Unlock the secrets of successful swing trading with our curated list of the Top 5 Swing Trading Webinars for Stock Market Traders. Gain valuable insights, expert strategies, and proven techniques to enhance your trading skills.
Do you know that technical analysis has many indicators to guide us but all of them are not suited for intraday trading! Yes, some particular technical indicators are best suited for traders who want to square off their position within...
Intraday trading is still one of the most popular types of trading. However, many people fail at intraday trading because they do not follow a set intraday strategies and trade based on their mood. Let's look at some of the...
Intraday trading, also known as day trading, can be a profitable way to invest in the stock market. This beginner's guide will teach you the basics of intraday trading.

Read the blog to know 7 webinars that will guide you on how to do intraday trading
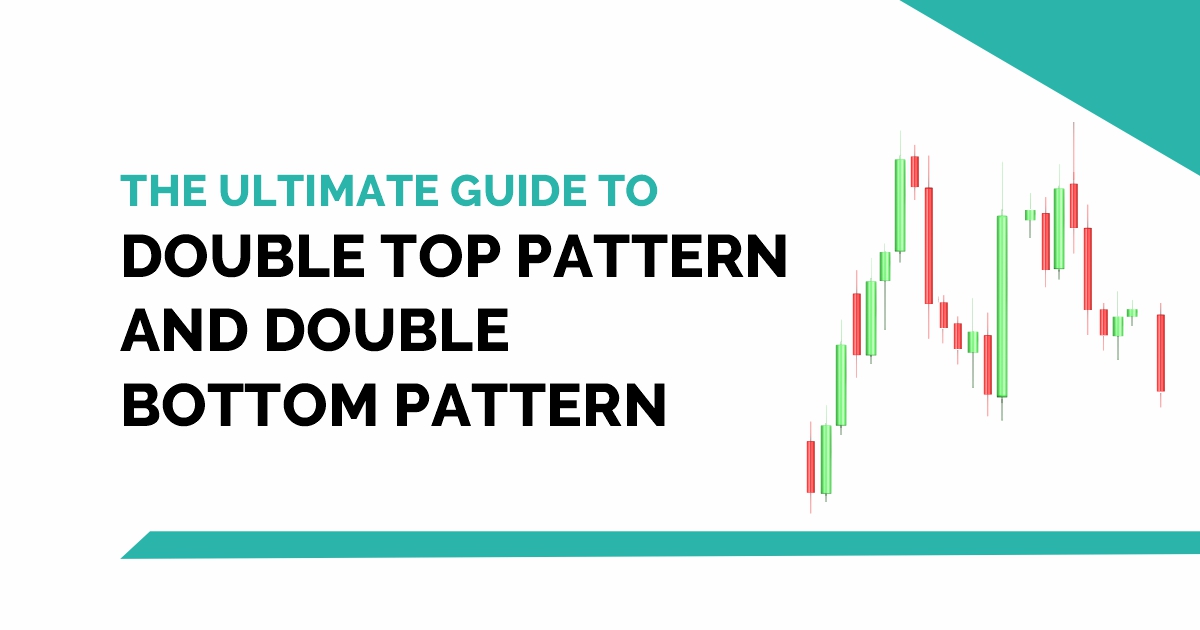
Double top and double bottom chart patterns are important technical indicators in stock trading. Learn how to identify and interpret these patterns with this blog.
Master the art of Price Action Trading Strategies with our comprehensive guide. Learn to decipher market movements, make informed decisions, and seize trading opportunities
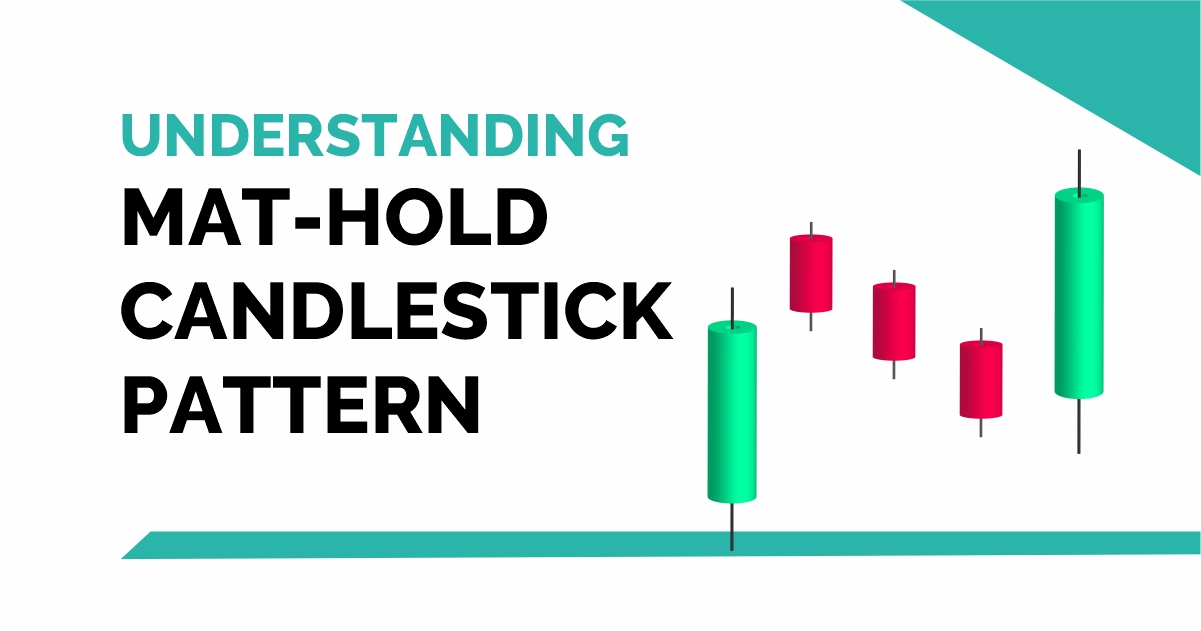
The Mat-Hold candlestick pattern is a five-candlestick pattern that appears during a trend and indicates that the market is likely to continue moving in the same direction.