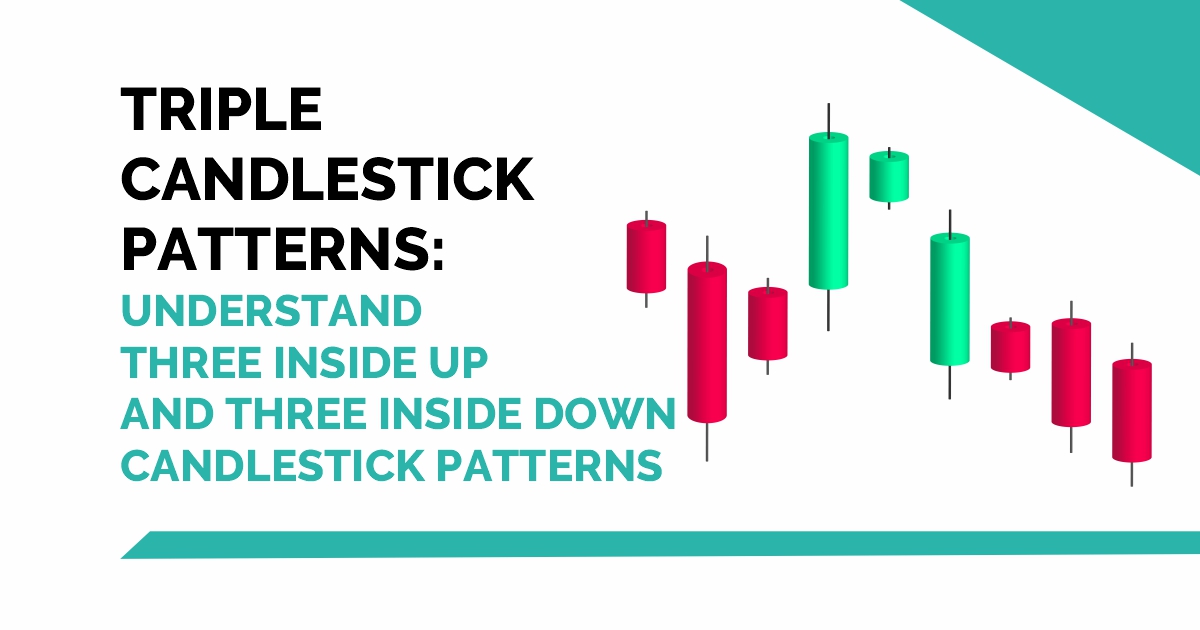
On candlestick charts, the three inside up and down patterns are types of candle reversal patterns.
The three inside up/down pattern requires the individual candles to form a specific sequence, indicating that the current trend has lost its former momentum and is likely to change direction.
The three inside up/down patterns are bullish and bearish reversal candlestick patterns, respectively. So, in today’s blog will discuss these triple candlestick patterns in detail:
What is Three Inside Up Candlestick Pattern?
One big downward candle, another smaller upward candle that remains contained within the previous candle, and ultimately, a third upward candle that closes above the second candle’s closing make up the three inside-up candlestick patterns.
As a result, this pattern is classified as a bullish reversal. However, it may not always reflect any slight or big change because it is a short-term movement. By considering the general trendline, traders advocate adopting the three candle up/down patterns.
As a result, the three inside-up patterns look bullish, as shown below. This signifies that the asset’s downtrend has ended, and the price may now begin to rise.
Formation
Let us discuss how this candlestick pattern is formed-
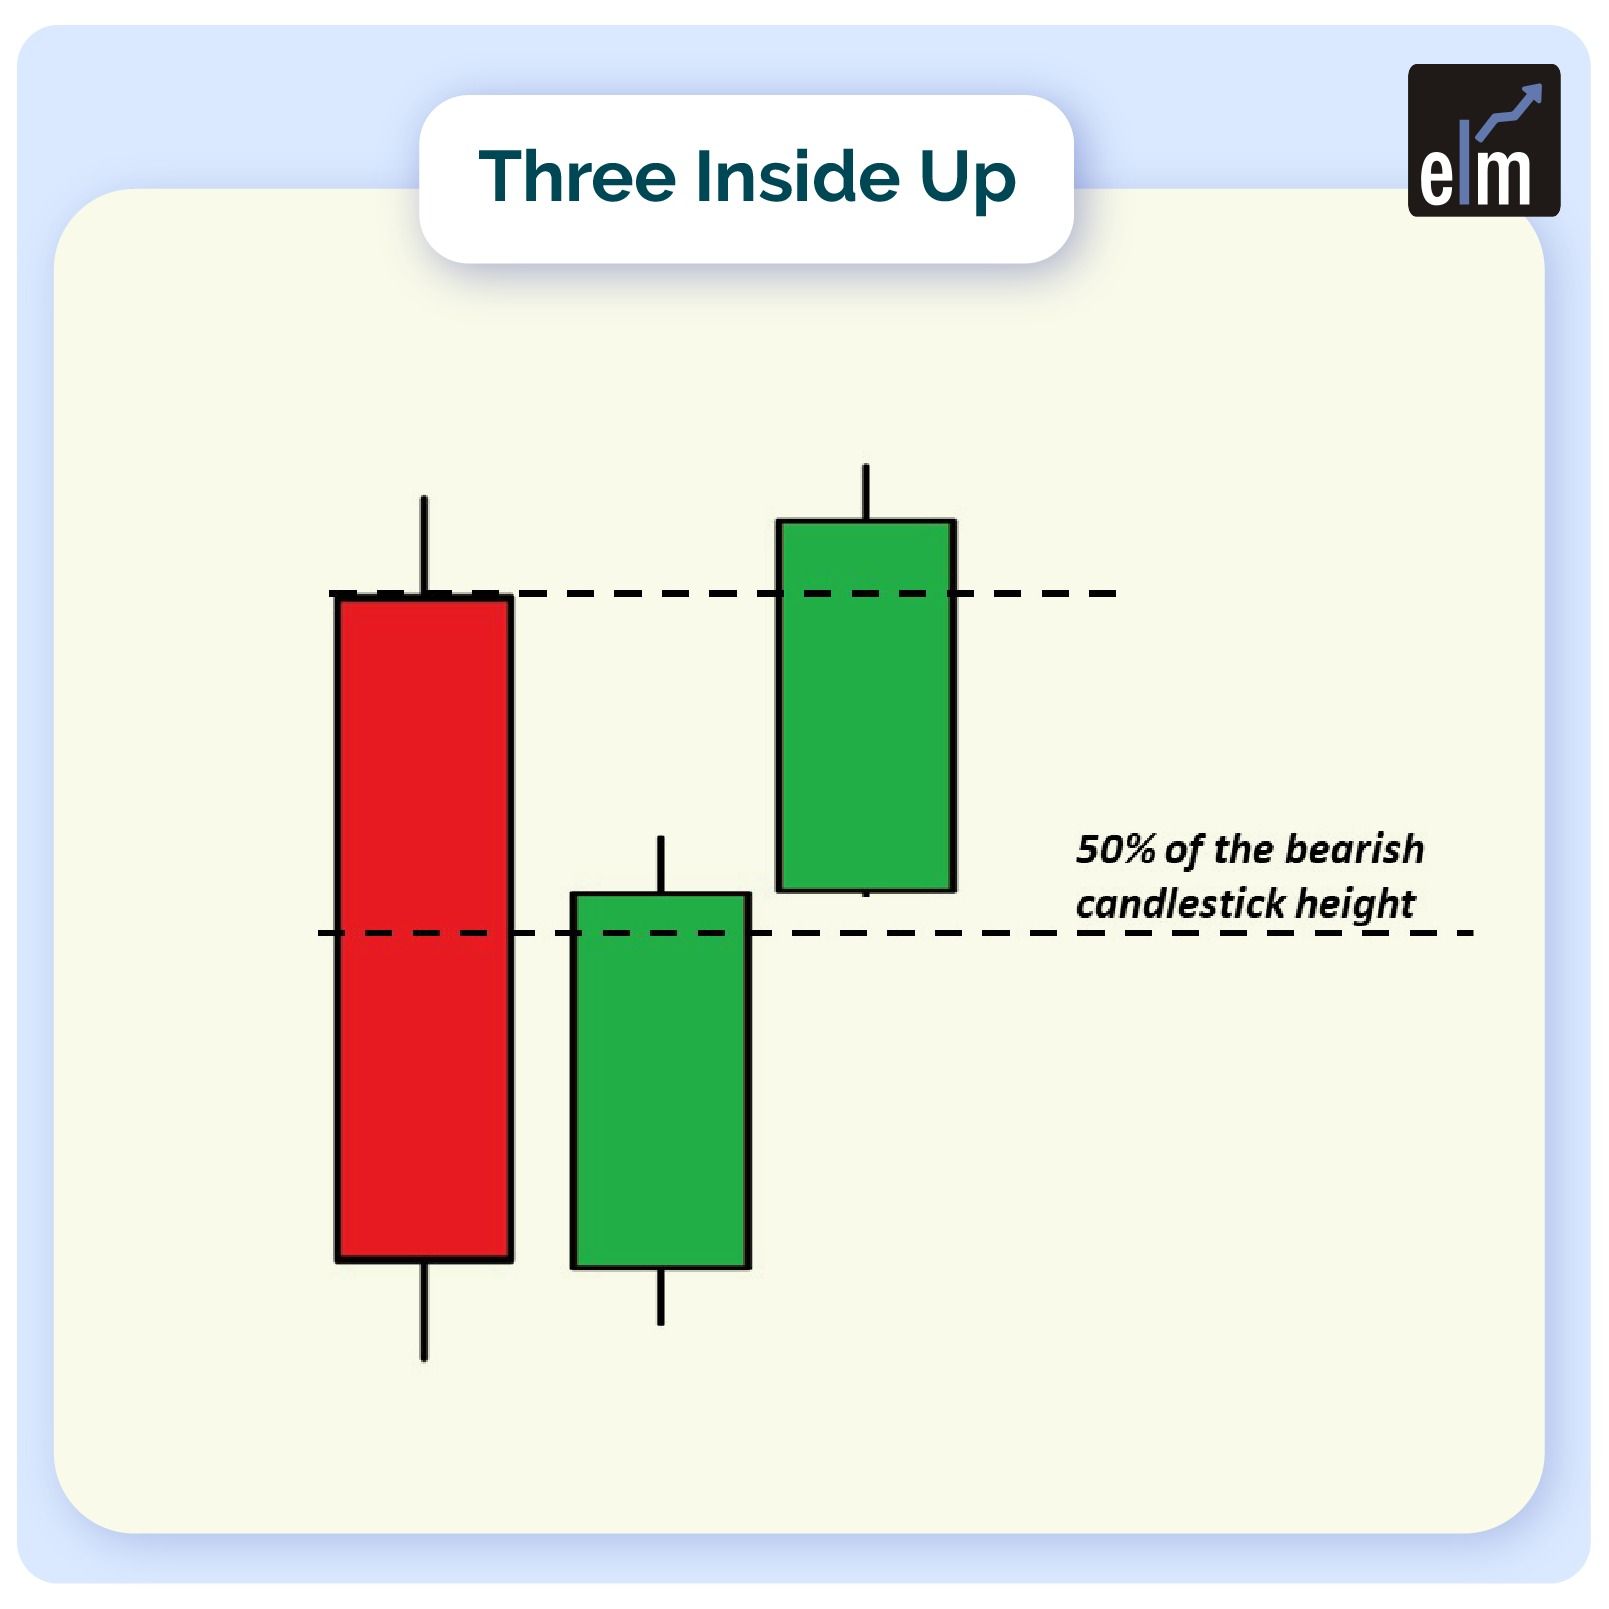
1. The market must first be downtrend to see a three inside up candle pattern.
2. The first candle will be a down candle with a large body. A down candle, sometimes known as a black candle, implies a falling price.
3. The next candle is an up candle, indicating a break in the downward trend. This up candle’s body will be small enough to open and close without touching the first black candle’s body.
4. Finally, the third candle will be white and close over the second candle.
What Traders Interpret from a Three Inside Up Pattern?
On the first candle, the downtrend continues, with a massive sell-off creating new lows. This usually boosts seller confidence while deterring new buyers.
The first candle’s downtrend causes a significant sell-off while setting new lows. As a result, the second candle will open within the trading boundary of the previous candle.
Instead of continuing to the downside, it closes higher than the current open while remaining within the first candle’s borders.
This is usually a red flag for short-term sellers looking for a way out. The third candle completes the general bullish reversal. It traps any lingering short sellers while simultaneously enticing new long traders.
Trading Example
There is no need to trade when the three inside up candlesticks appear. Instead, it might simply be used to notify sellers that the short-term pricing is changing.
Those who don’t want to trade through this candlestick pattern might place a long position on the third candle towards the end of the day. It might also be used for a bullish three inside up on the next open, as shown below:
A stop-loss can also be put directly beneath the close of any of the three candles. But, again, the trader’s risk appetite will determine which candle is used to place the stop loss.
What is Three Inside Down Candlestick Pattern?
This candlestick pattern occurs after a bullish trend. For example, a single long bullish candle is followed by two slightly smaller bearish candles in this pattern.
When this pattern appears at the top of an uptrend, it signals a bearish reversal, with the asset’s price falling.
Formation
Let us discuss how this candlestick pattern is formed-
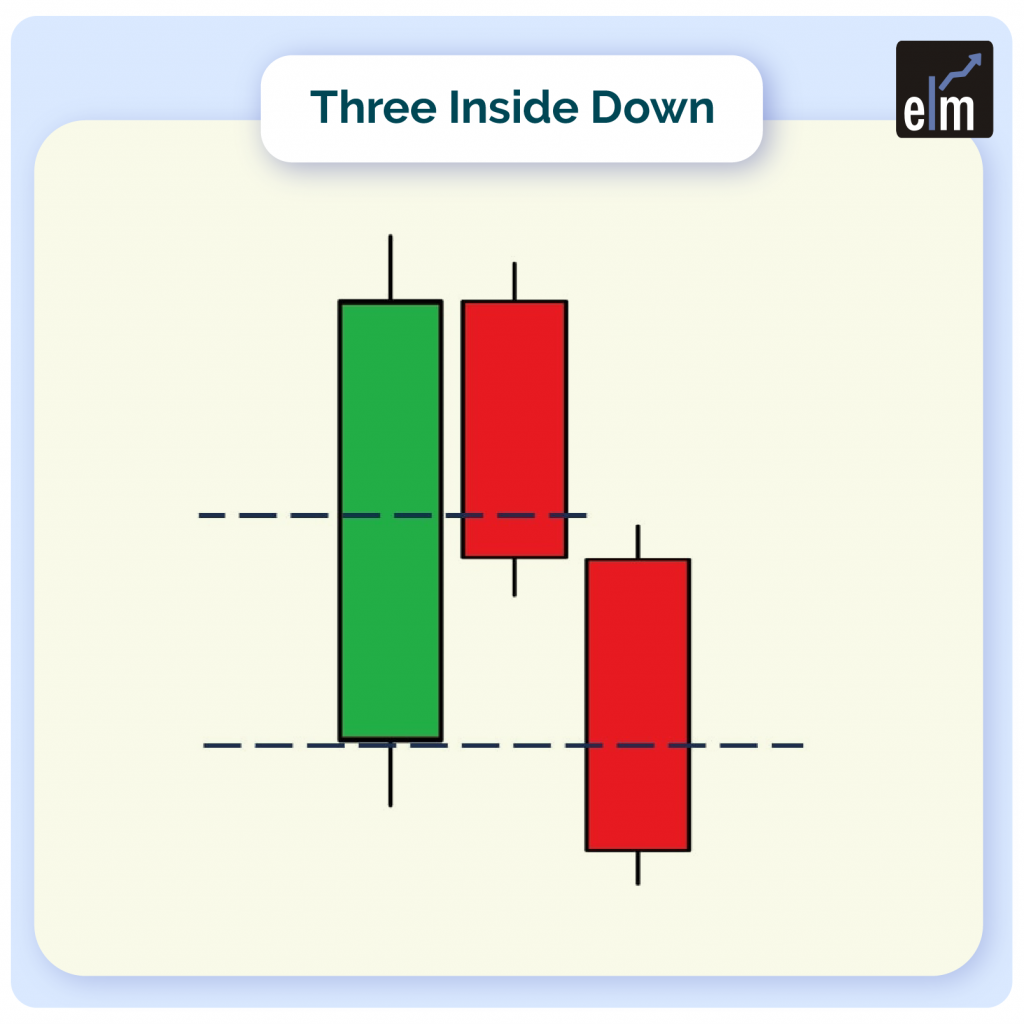
First, check the candlestick charts for a strong bullish trend. Look for a long bullish candle once you’ve found the bullish trend. The first candle in the three inside down patterns would be this one.
After spotting the lengthy bullish candle, look for a small bearish candle on the charts. Ideally, the second candle should be brief and confined within the first long bullish candle.
The pattern’s initial two candles should resemble a bearish harami. This stage of the pattern is crucial. As a result, only consider entering a trade if the second candle in the pattern meets these requirements.
What Traders Interpret from a Three Inside Down Pattern?
As you can see in the chart below, the asset’s price is going upward, indicating the bulls’ firm grasp on the market. The first of the three inside down candlestick patterns closes favourably following the trend. The candle’s body appears long, with the bulls dominating strongly, indicating that the trend will continue.
The pattern’s second candle, on the other hand, begins with a ‘gap down.’ The bulls are utterly thrown off their trend and concerned as a sudden and unexpected down-move occurs in the middle of a strong rise.
Meanwhile, the bears make a powerful entry and seize charge of the session by pushing through the gap-down opening.
The purchasing demand has faded by this time, leaving the bears in command. In the third session, the selling pressure increases even more, with the bears continuing to sell. As a result, the pattern’s third and final candle likewise becomes red.
Here’s something important to keep in mind. The third bearish candle must close below the second short bearish candle and the first long bullish candle for the three inside-down candlesticks to be effective. So this big downward movement in the third session confirms the bearish trend reversal.
Read More- All 35 Candlestick Chart Patterns in the Stock Market
Bottomline
When used in conjunction with other technical analysis techniques, the Three Inside Up/Down patterns can help traders spot possible trend reversals. When combined with other technical indicators, these patterns can be utilized to improve trade decisions by indicating a change in market sentiment. Traders can increase their odds of making profitable trades by comprehending how the Three Inside Up/Down patterns form and what they mean.
Frequently Asked Questions (FAQs)
What is three inside up candlestick pattern?
The pattern known as Three Inside Up suggests a possible bullish reversal. A long bearish candle at the start of the pattern indicates a persistent downtrend. A smaller bullish candle, the second one opens and closes inside the body of the first. This denotes a brief stop or stabilization.
What is a 3 top candle pattern?
Technical analysts utilize chart patterns like the triple top to forecast when the price of an asset will reverse course. A triple top, which consists of three peaks, suggests that the asset might not be rallying any longer and that lower prices might be approaching.
What does a triple candlestick mean?
This triple candlestick pattern suggests that a new upswing may have begun and that the downturn may have ended. Look for these characteristics in a three inside up candlestick pattern to be sure it’s valid: The first candle, which has a long bearish candlestick, should be located at the bottom of a downtrend.


