
The Rate of Change (ROC) is a price-based indicator that measures how quickly the price changes from one period to the next. The typical rate of change definition measures the current price to a defined look-back period.
When expressed as a percentage, however, ROC can assist traders in determining not only momentum but also overbought and oversold conditions, as well as the ROC is a momentum oscillator; similar indicator types to ROC include and.
Any financial asset can theoretically rise indefinitely, but it can only fall to zero. This means negative ROC values are constrained, but positive ROC values are not.
In today’s blog, let us discuss how to trade with the Rate of Change Indicator:
What is the Rate of Change Indicator?
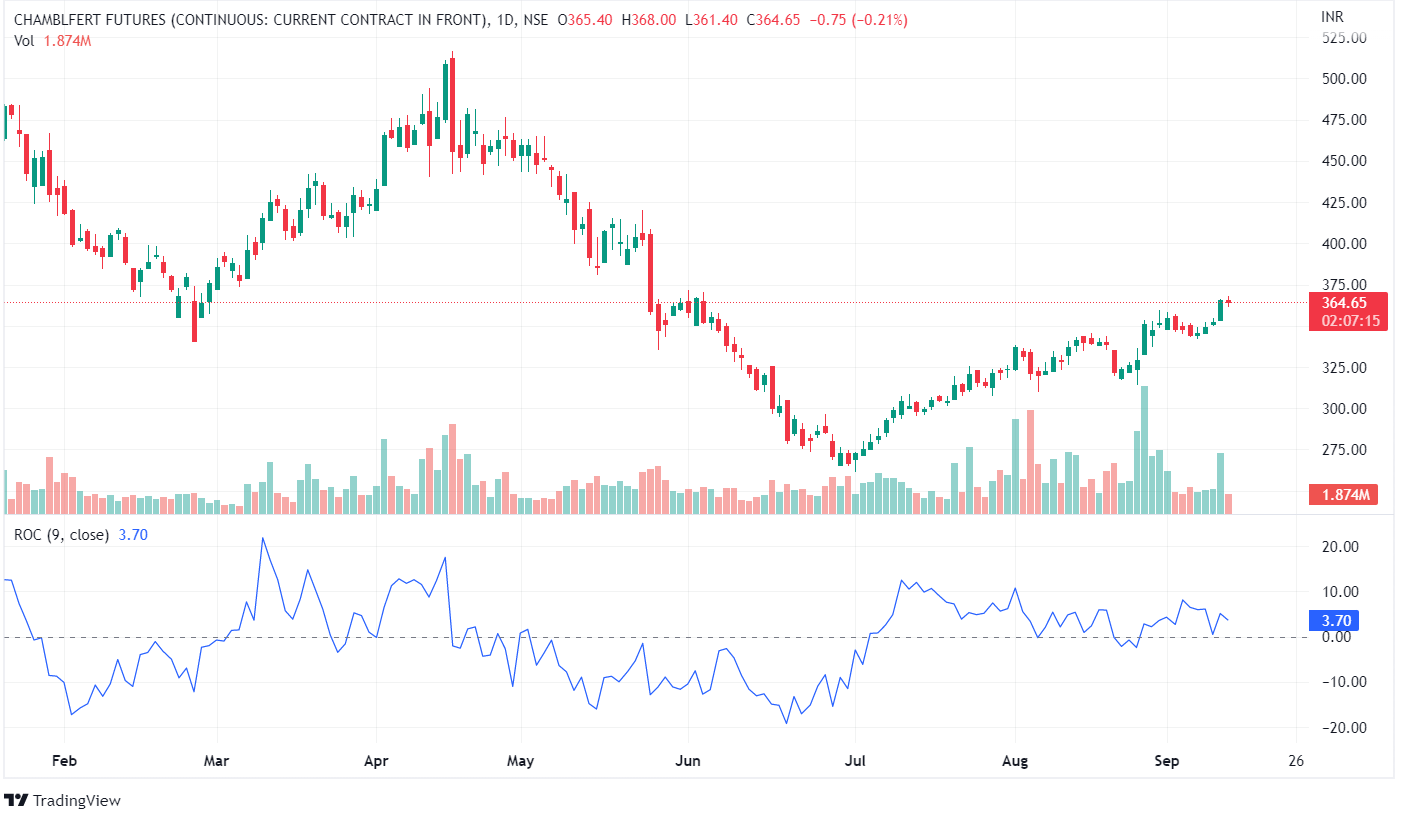
The price rate of change indicator (PROC), also known as the rate of change indicator (ROC), is a price-based technical oscillator displayed in the sub-window. The PROC indicator is frequently referred to as a momentum oscillator.
The PROC or ROC oscillator, as the name implies, measures the rate of change in price over a given period. The ROC indicator compares the current price to the price for the look-back period, depending on the configurations used.
With some smoothing, the ROC oscillator moves from positive to negative around the 0-line. When momentum increases, the ROC oscillator moves from negative to above the 0-line, and when momentum decreases, it moves from positive to negative and above the 0-line.
How to read the ROC Indicator?
When using ROC to compare prices from a previously defined period, the indicator values will be either above or below zero. The number zero will serve as the centerline. When indicator values are close to zero, the market consolidates.
A reading above zero indicates a bullish market sentiment, while a reading below zero indicates a bearish market sentiment. Despite being used as an oscillator, the ROC has no defined overbought and oversold levels.
Traders identify such zones by looking at the previously extreme levels of the ROC printed to the underlying asset’s price.
How to trade with ROC Indicator?
Below are the ways one can trade with the ROC Indicator:
1. Zero-line Crosses
A zero-line cross on the ROC indicates the emergence of a new trend. A cross of the zero-line from below indicates the start of a bull trend, whereas a cross from above indicates the start of a downtrend.
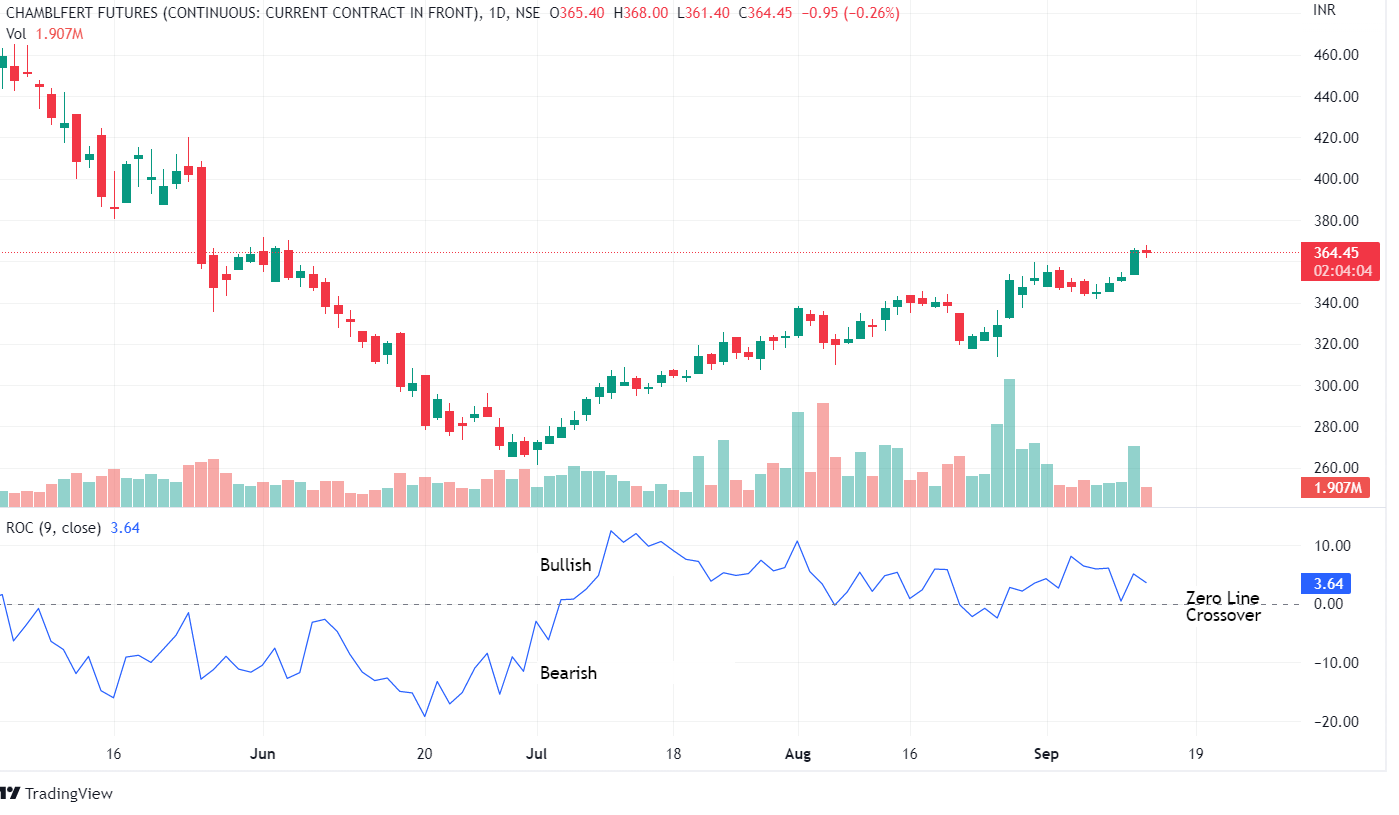
As previously stated, it is critical to consider the asset volatility and timeframe chart to reduce false or whipsaw ROC signals generated by zero-line crosses.
2. Overbought and Oversold
Momentum indicators are particularly useful for trading ranging markets because they aid in accurately forecasting turning points. In a ranging market, if a trend loses momentum, it is best to look for opportunities to trade in the opposite direction.
Peaks and troughs can occur after a certain amount of time or after a certain percentage move. Based on previous printed indicator levels, ROC provides a clear picture of when to expect such turnarounds as an unbound indicator.
3. Breakouts
Breakouts happen when there is a lot of momentum, and what better indicator to use to qualify breakouts than the ROC?
ROC will identify flat values when the price is consolidating or ranging. Conversely, a sustained sharp rise or fall will confirm that the breakout trend will continue.
4. Divergences
Divergences are excellent for predicting market turning points, and the ROC, as a momentum indicator, can provide accurate and compelling divergence signals. A bullish divergence occurs when the price forms lower lows while the ROC prints higher lows.

This will indicate that the downtrend has lost momentum and that a trend change to the upside is imminent. A bearish divergence occurs when the price makes higher highs, but the ROC makes lower highs.
You can also join our course on Certification In Online Technical Analysis
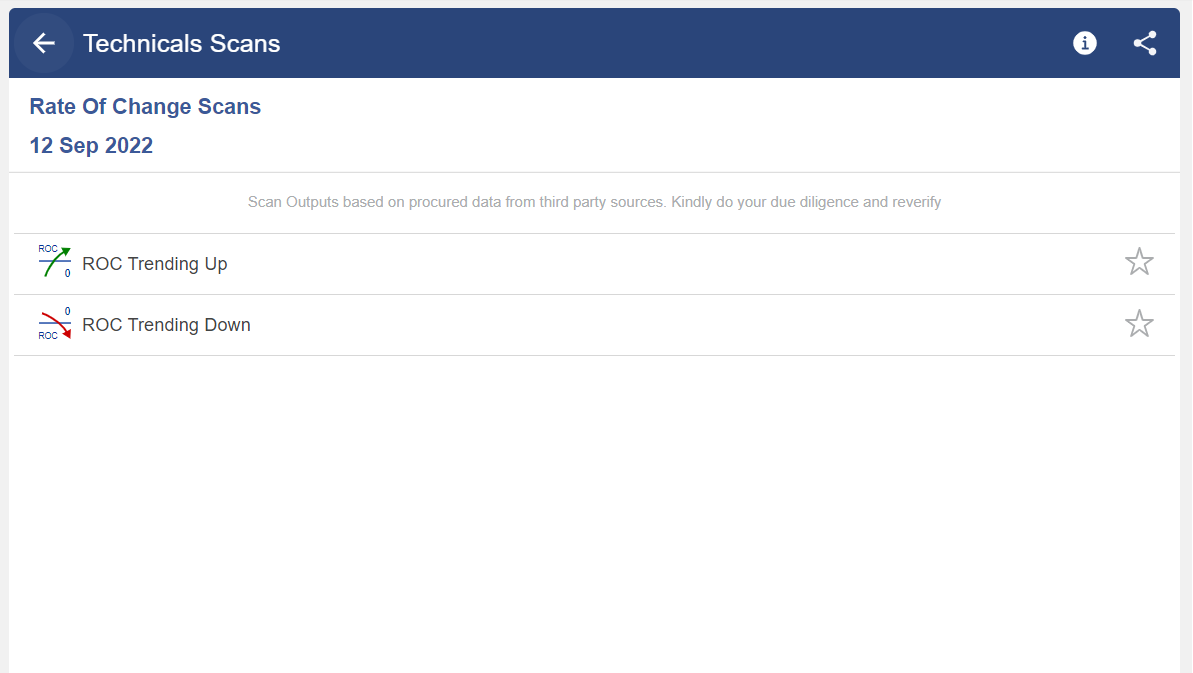
ROC Scans In StockEdge
You can also use ROC scans available in StockEdge that helps us to filter out stocks based on certain criteria, as shown below:
Bottomline
The price Rate of Change Indicator is abbreviated as ROC. It is a momentum indicator that measures the percentage change in price, providing traders with information on how quickly the price rises or falls.
The obvious takeaway is that the faster the price changes, the stronger the trend’s momentum. Overbought and oversold conditions, divergences, and centerline crossovers are all common uses for the indicator. Because of its proclivity for whipsaws, the indicator is best used as a confirming indicator.
We hope you found this blog informative and use it to its maximum potential in the practical world. Also, show some love by sharing this blog with your family and friends and helping us in our mission of spreading financial literacy.
Happy Investing!


