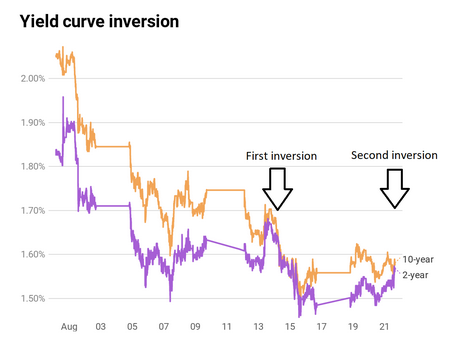
With yield on 10-year high, US Bond having fallen below 2-year bond yields for the first time since 2007, the phase “inverted yield curve” has found its way back into the media.
You must have heard and wondered what on earth were they talking about?
To understand what message a yield curve is sending, we first need to understand what bond is.
A bond is a debt instrument created for the purpose of raising capital. They are loan agreements between the bond issuer and an investor, in which the bond issuer is obligated to pay a specified amount of money at specified future date.
Bond is also known as fixed-income security.
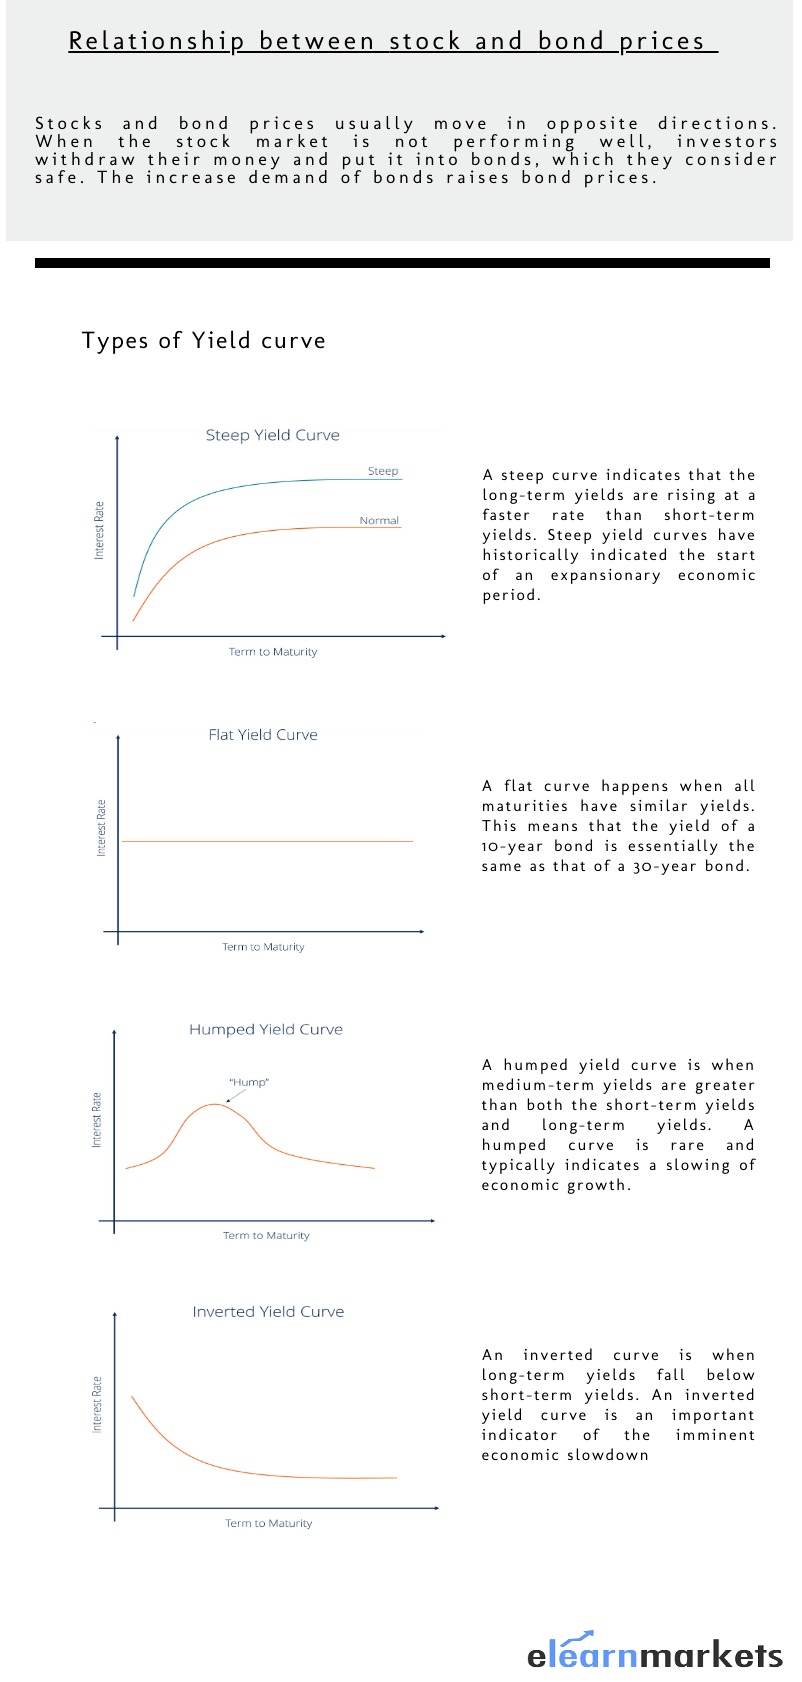
Relationship between Stocks and Bond
Stocks and bond prices are usually inversely related that is if stocks rise bonds fall and vice versa.
When the stock market is not performing well, investors withdraw their money and put it into bonds, which they consider as safe haven.
The increase in demand of bonds during bear market raises bond prices.
When the stocks start rallying and the risk seems less, investors move out of bonds and shift their money into stocks, driving stock prices up further.
How do bond prices and yield behave in bull market and bear market?
A bull market is the condition of a financial market in which stock prices are continuously rising or are expected to rise.
To beat inflation and earn alpha returns, investors start selling their bonds and buy stocks.
This drives bond price lower and bond yields higher.
On the contrary:
A bear market is a condition in which stock prices fall generally 20% or more from recent highs.
Because of pessimism and negative sentiment in the market, Investors start shifting to bonds (safer assets class) to get the regular guaranteed interest payment which drives bond prices higher and bond yields lower as money moves into bond market.
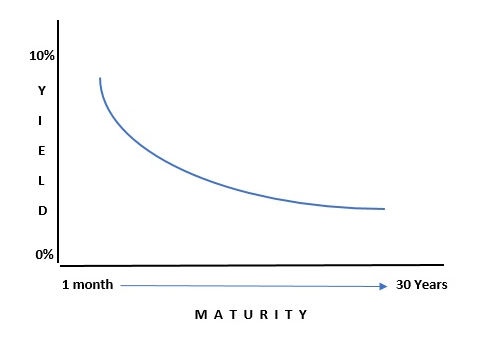
A yield curve is simply a graphical representation between a Bond’s yield (government bonds) and its range of maturities.
It shows the yield an investor is expecting to earn if he lent his money for a given period of time. (Yield refers to the interest earned by an investor on a bond till it matures)
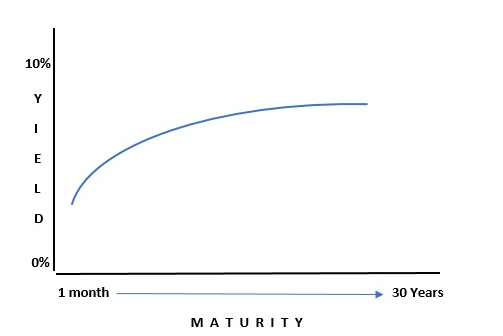
The graph displays the bond’s yield on the vertical axis and the time to maturity across the horizontal axis.
The Government issues bonds with maturities ranging from the very short term (less than a year) to very long term (up to 30 years).
Short-term bonds typically offer lower yields because they pose relatively little risk to an investor’s money.
Longer-term bonds typically pay more to compensate the risk of inflation, liquidity and many other uncertainties.
The curve takes different shapes at different points in the economic cycle like Steep, Flat, Inverted, and Humped yield curve.
Inverted Yield curve
A yield curve is inverted when the yields on bonds with shorter duration are higher than the yields on the longer-dated bonds.
Why inverted yield curve happens?
The short-term bond yields are highly sensitive to the interest rate policy whereas the performance of the longer-term bonds is largely determined by market forces.
When investors are worried about growth and feel that recession is looming, they start investing in (safe assets) long-term Treasury bonds which drives longer-term bond prices higher, and pushes yield lower.
Inversely, the demand for short-term bond falls, which drives the prices to lower.
Lower prices brings higher yields.
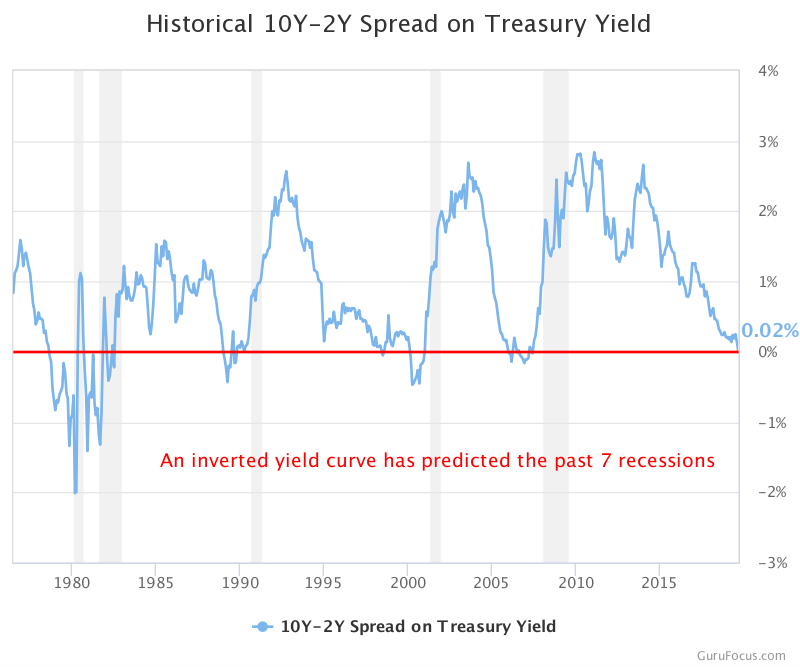
The most commonly feared inversion arrives when a 10-year bond yield fall under a two-year bond yield. This inversion is regarded as one of the most consistent recession indicators for the economy.
Historically, economic recessions occur when the spread between the 10-year yield and the two-year yield is less than zero.
you look carefully at the historical spread chart below, you will notice grey bars throughout the charts. These bars indicate the past U.S. recession since 1976.
What to do about an inverted yield curve?
The inverted yield does not mean that the economy will enter into a recession.
The inversion that took place in 1966 and 1998 were not followed by recession.
However, an inverted yield curve does strongly remind investors that recession is inevitable and that they should be careful to maintain proper asset allocation in their portfolio, rather than trying to make tactical moves in anticipation of the market downturn.
Key- takeaways
The yield curve is often viewed as a leading indicator. It provides an early warning of the direction of the economy.
Inverted Yield curve don’t come very often. But when they do come, they tend to send investors and policy makers into a worry.
The 10-2-year US Treasury spread has a general tendency to signal the market’s expectation of an upcoming recession or general downturn in growth.
An inverted yield curve, like most other indicators, is not perfect and doesn’t mean a recession is imminent.
In order to get the latest updates on Financial Markets visit Stockedge


