Upside Tasuki Gap is a bullish continuation candlestick pattern which is formed in an ongoing uptrend.
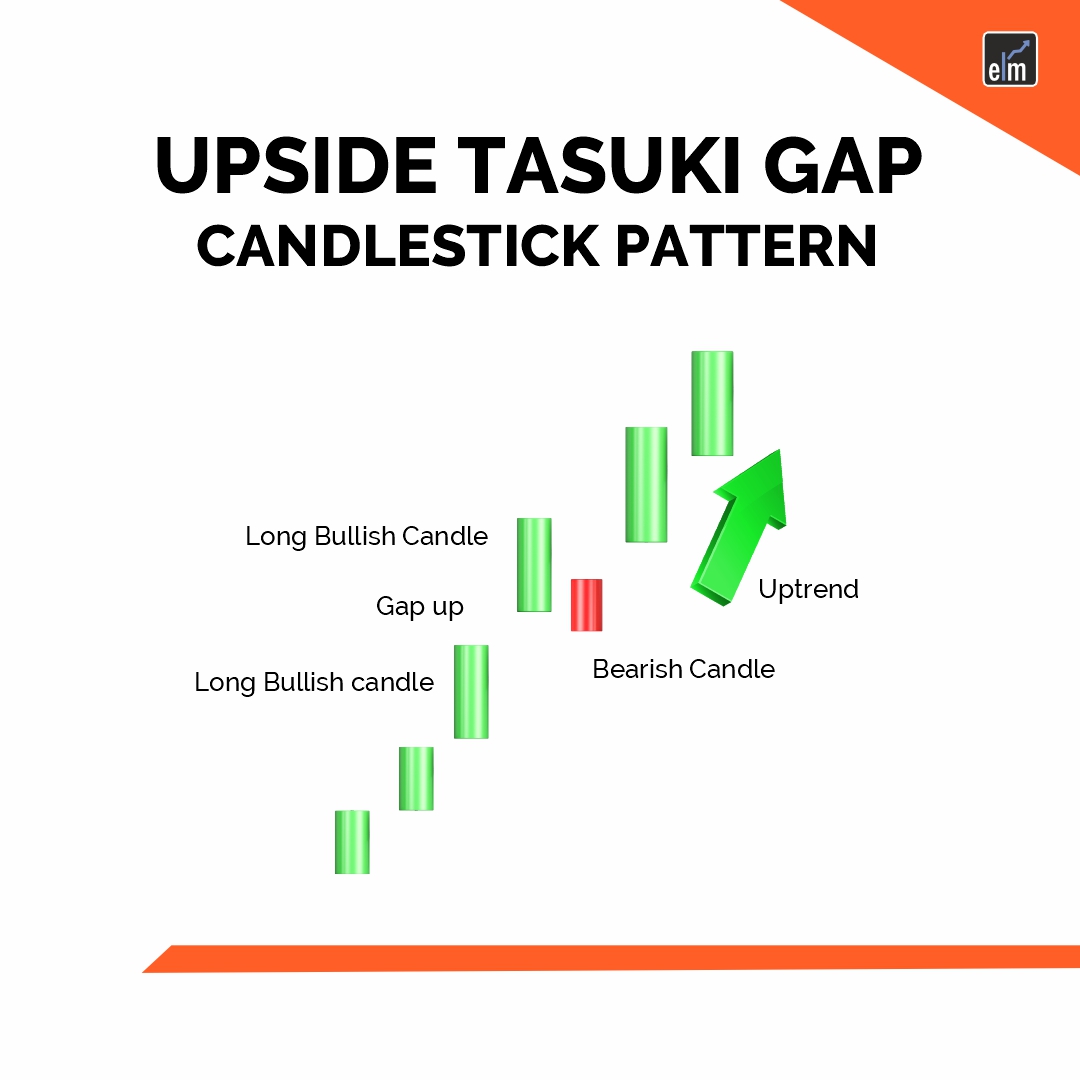
This candlestick pattern consists of three candles, the first candlestick is a long-bodied bullish candlestick, and the second candlestick is also a bullish candlestick formed after a gap up.
The third candlestick is a bearish candle that closes in the gap formed between these first two bullish candles.
In the blog let us take a closer look at what this candlestick tells us about the market and how we can trade with this candlestick.
What is Upside Tasuki Gap?
It is a type of gap patterns that can be formed many times in a strong bullish trend.
This candlestick pattern confirms the strength of the ongoing uptrend and also adds confirmation to a bullish trading strategy.
It indicates an uptrend’s strength by the gap up of the second candle and indicates that the ongoing uptrend is going to continue.
This candlestick pattern is also known as the Bullish Tasuki Gap or the Upward Gap Tasuki or Bullish Tasuki Line.
When this candlestick pattern occurs in a bearish market, then it is known as a Downward Tasuki Gap.
Both patterns are the types of candlesticks continuation patterns.
What Does this Gap Tell Us?
In the ongoing uptrend, the traders’ sentiment is positive and they expect the ongoing uptrend will continue.
And as per their expectations, the first candle of this Gap is formed, which is a long-bodied bullish candle.
The positive sentiment of the bulls continues in the next trading session making the candle gap up, and the second candle also becomes a long positive one.
Due to the two long bullish candles, with a gap up in between, the traders are becoming worried that the market may become overbought and a bearish reversal might come.
Because of this fear, the third candle is a bearish one that closes below the opening of the second candle.
But traders believe that the third candle is just a temporary pullback, and the buying pressure increases that push the prices up, and the uptrend continues.
Read More- All 35 Candlestick Chart Patterns in the Stock Market
Formation of Upside Tasuki Gap:
Here is the formation of this Gap:
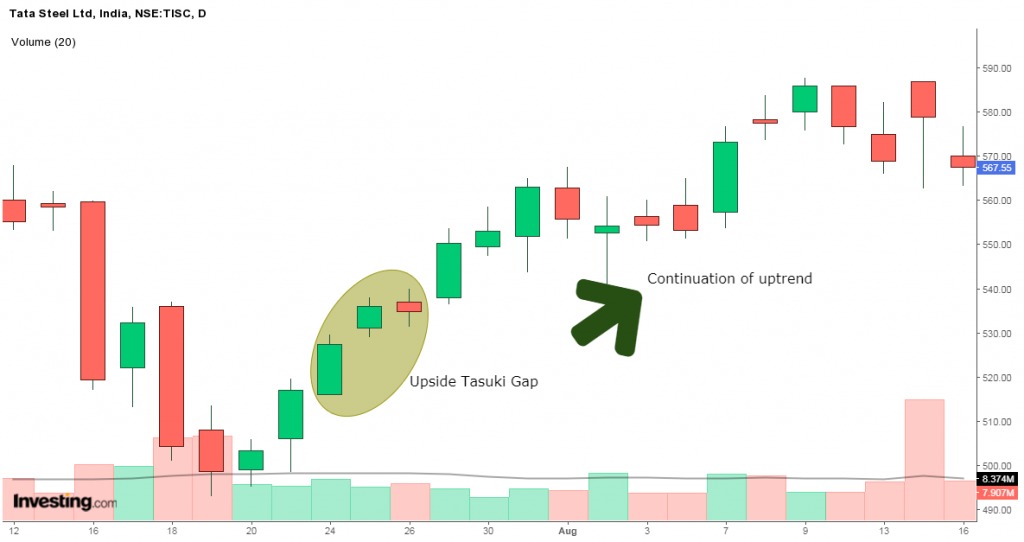
Upside Tasuki Gap Example:
We can see how this gap is signalling the continuation of an uptrend as formed in the daily chart of Tata Steel Ltd:
How to use it in StockEdge?
You can also use the Upside Tasuki Gap scan in the StockEdge.
Steps to use this scan:
Under the “Candlestick Scans” we can see Bullish Continuation scans as shown below:
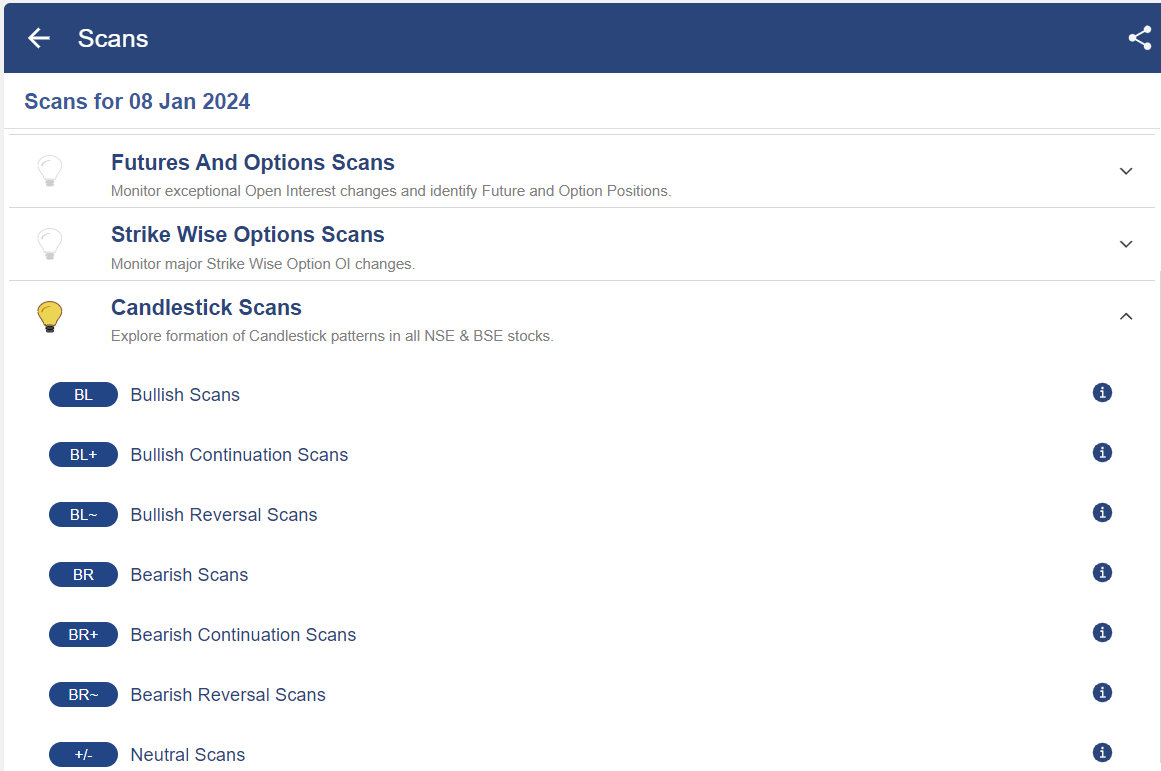
When we click on the “Bullish Continuation scans” we can see “Upside Tasuki Gap” scan, click on that:
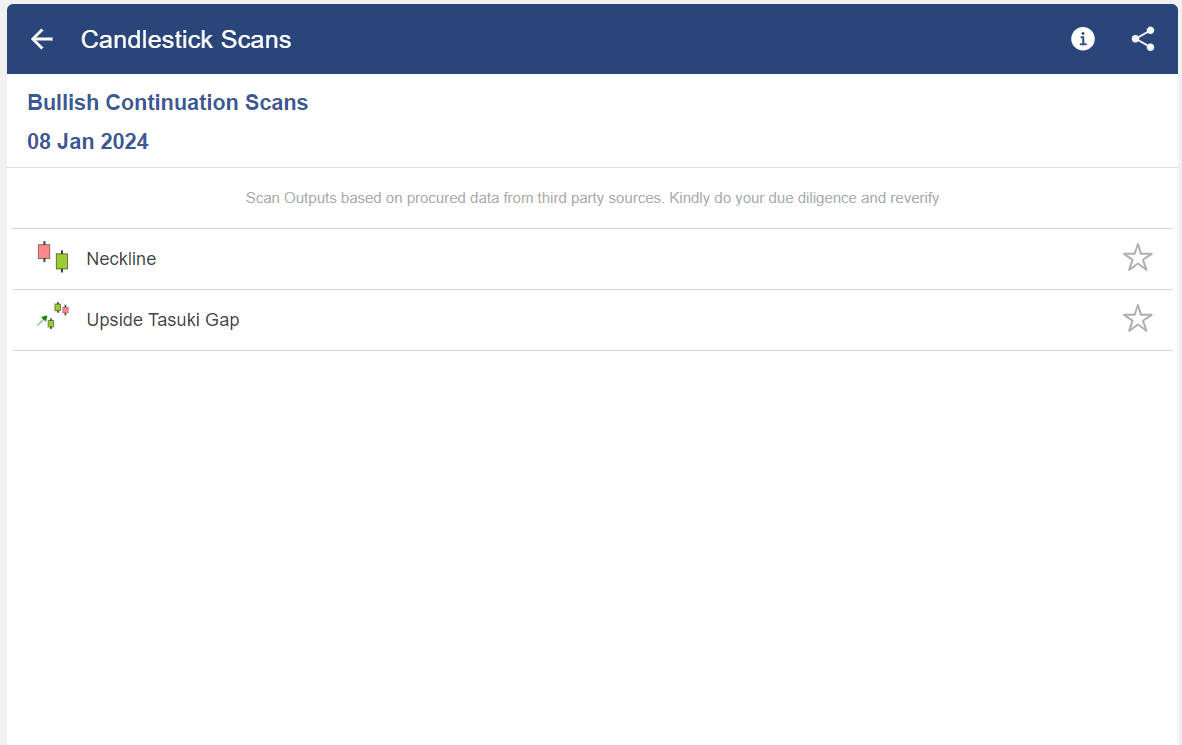
After selecting on it, you will get a list of stocks in which this pattern is formed.
As we have discussed above traders should also watch if the volume is supporting the formation of this gap.
Traders should also use this gap with other technical indicators like trend lines, moving averages, and bands to confirm the bullish continuation signal given by this pattern.
Bottomline
The Upside Tasuki Gap is a bullish continuation candlestick pattern formed in an ongoing uptrend. This candlestick pattern consists of three candles, the first candlestick is a long-bodied bullish candlestick, and the second candlestick is a bullish candlestick formed after a gap up. When this candlestick pattern occurs in a bearish market, then it is known as a Downward Tasuki Gap. Traders can confirm the signal given by this candlestick by analyzing volume and other technical indicators.
Frequently Asked Questions (FAQs)
What does upside tasuki gap mean?
A three-bar candlestick pattern known as the Upside Tasuki Gap indicates that the present upswing will continue. The distance between the first two bars of the Upside Tasuki Gap is partly closed by the third candle. In addition to the Upside Tasuki gap, traders frequently employ other gap patterns to validate bullish price action.
What is the bullish upside gap?
Positive Upside Gap Three Candles make up Three Methods. In the direction of the trend, a second lengthy white candle follows the previous one. As a black candle, the third day bridges the space left by the previous two.
What is down side tasuki gap?
A Drawback A candlestick pattern known as the “Tasuki Gap” is frequently used to indicate that the present slump will continue. When a string of candlesticks exhibits the following traits, a pattern is created: 1. Within an already-existing downward trend, the initial candle is red or backward.


