Hanging Man
The next candlestick pattern that we will learn is usually formed at the end of an uptrend which is a Hanging Man candlestick pattern.
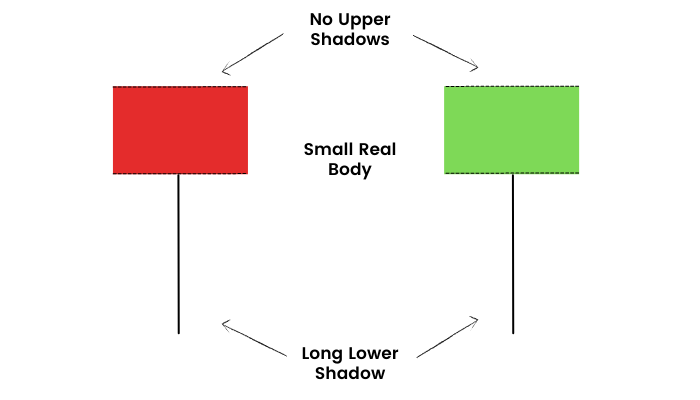
Hanging man is a bearish reversal single candlestick pattern. It has a long lower shadow & a small real body. A hanging man appears at the end of an uptrend indicating weakness on the upside price movements. This means the bulls have lost their strength & bears have taken over.
So how can we identify such a pattern?
- There is no or a little upper shadow
- The lower shadow is at least twice as long as the real body.
- The real body is on the upper end of the candlestick.
Here is a formation of the Hanging man candlestick pattern:
What is the psychology behind the pattern?
The prior trend of the market was up. In continuation of the previous trend, the market opens higher. This signifies that bulls are still active. During the session, the bears take over, and some sell-off from the top is noted. This could possibly be profit-booking by smart money. The price eventually bounces back & it closes near its high. Since sell off was noted at higher levels post-confirmation, we can expect a reversal to occur.
Confirmation
The trend reversal will be confirmed if the next candle breaches the hanging man candle low. Traders can go short once the price breaches the low of the hanging man candle keeping high as the stop loss.
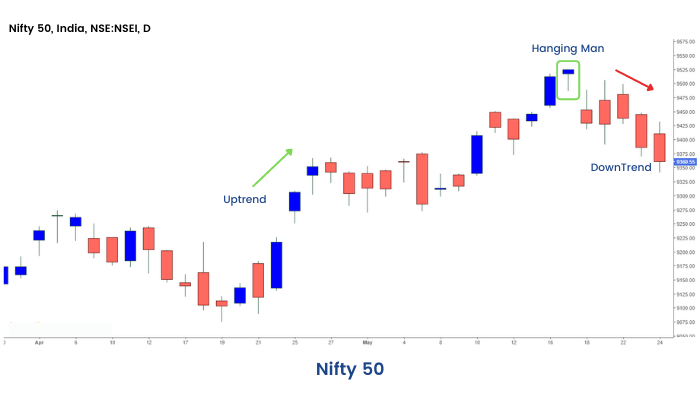
Example: we can see the formation of the Hanging Man candlestick pattern on the Daily chart of Nifty 50 below: