Uses of Moving Averages
Let us now discuss the various uses of Moving Average.
1.Moving Average is Trend Following Indicator:
Moving Averages only work when there’s an uptrend or a downtrend in a market. They don’t work in a sideways market. Moving average is a trend identifier. One way to identify trends is by drawing trendlines. Averages are another important tool used by traders to identify the trend. If the price is moving above the moving average, it means that it’s in a positive or an uptrend. If prices are trading below the moving average it depicts that the trend is down or negative.
2.Slope:
Let's take the example of Crude Oil to understand this point. A few years ago, the price of crude oil was approximately trading at $35 per barrel. Today, the prices are around $75 per barrel. So we see that the average prices over a period of time have risen. We can say that the slope of crude oil is in bullish momentum. Since the averages themselves are rising, we can infer that the trend is upward for the asset class. If moving averages are rising, the trend is up and vice versa. We can assess an instrument's trend for short-term, medium-term and long-term through a moving average. If the price is above the 21-day period, 55-day period, 100-day period, and 200-day period, it means that the stock is in a positive trend in the short-term, medium-term, long term and very long term. This stock is positive. As long as all the four tenures are showing a positive trend, the stock is in the uptrend.
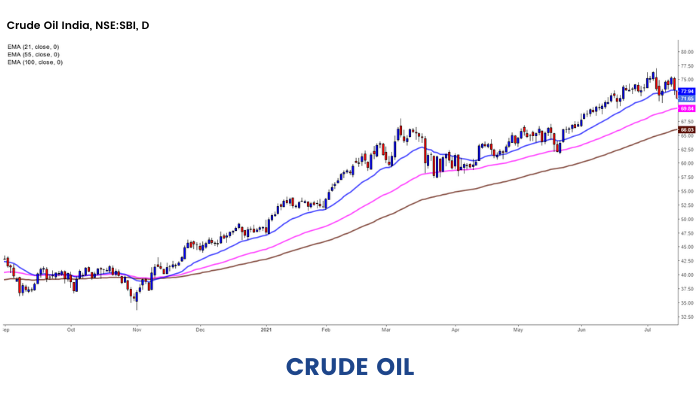
The above image shows the prices of Crude Oil, and the 21-period, 55-day period, 100-day period EMA is plotted. It clearly shows that the crude oil is in an uptrend, as the slope is up as well as prices trade above the averages.
3.Support & Resistance:
Moving averages work as dynamic support and resistance levels.It's not like the traditional horizontal support and resistance lines. They are constantly changing depending on recent price action. SImilar to the horizontal support and resistance areas, moving averages should be treated like zones or areas of interest. They depict demand and supply zones. In an uptrend, a 100 or a 200-day moving average can act as a support level. Whereas in a downtrend, it can act as a resistance level. When a trade is initiated, these averages can be used to identify the stop loss levels to the trade. It helps in managing the risk rewards. Since moving averages are dynamic in nature and they move with prices, the stop losses trail automatically with the trades.
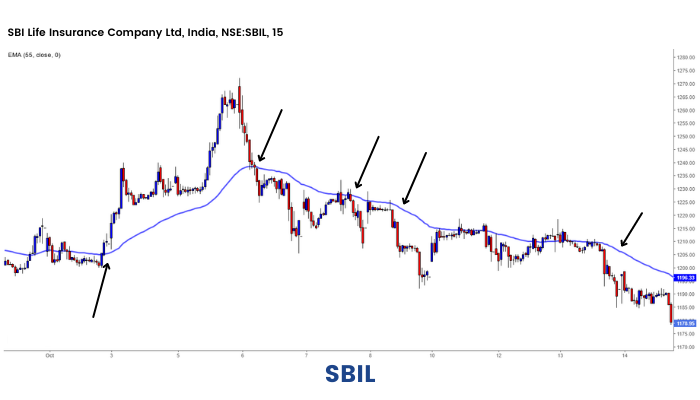
The chart below shows how a 55 period exponential moving average works as support and resistances at different places in the 15 minute time frame for SBI LIFE.