
Measuring Portfolio Performance
There are a variety of ways by which a portfolio’s performance can be measured. Over the years, different financial experts have come up with different kinds of ratios and measurement criteria to understand a portfolio’s performance. At the core of all these criteria lies the fact that investors want to achieve a maximum return by taking a minimum risk. Therefore, the methodologies which reward high return while penalizing high risk are most suitable for this purpose.
Here, we have discussed three measurement methods most widely used by portfolio managers.
Sharpe Ratio
This is probably the most commonly used measure. It was conceived by Bill Sharpe and closely follows his work Capital Asset Pricing Model.
The formula for measurement is:

Where:
PR = Portfolio return
RFR = Risk free rate of return
SD = Standard deviation
Let us understand this through an example.
Let us assume that there are 3 portfolios – A, B and C. Let us assume that the risk-free return in the market is 4%.
The individual return of each portfolio will look something like this:
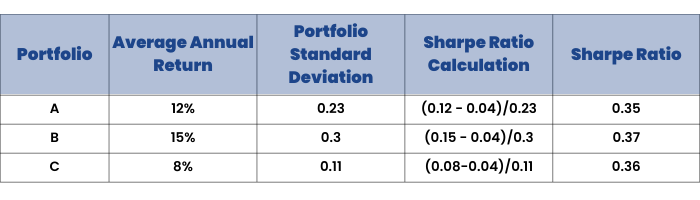
Things to note:
✔A higher Sharpe Ratio represents higher returns and lower standard deviation. Hence, it is good. Thus, in the above example, Portfolio B is the best performing one.
✔Since Sharpe Ratio measures risk in terms of standard deviation, it should be used for portfolios containing many assets, not just a few.
Treynor Ratio
Treynor Ratio is also a widely used measure. It was introduced by Jack L. Treynor to provide a composite measure of portfolio performance. This measure applies to all kinds of investors, irrespective of their risk tolerance.
✔According to Treynor, there are practically only two components of risk:
- Risk produced by fluctuations in the stock market
- Risk produced by fluctuations of individual securities
The concept of a security market line was also introduced by Treynor. A security market line is drawn on a chart and shows different levels of systematic risk or market risk, plotted against the expected return of the entire market at a given time. The higher the line’s slope, the better is the risk and return trade-off.
Since the Treynor ratio takes into account the volatility factor, it is often known as the reward-to-volatility ratio.
It is measured as:

Where:
PR = Portfolio return
RFR = Risk free rate of return
β = Beta
Let us come back to our previous example, as per Treynor Ratio, the portfolio performance would look something like this:
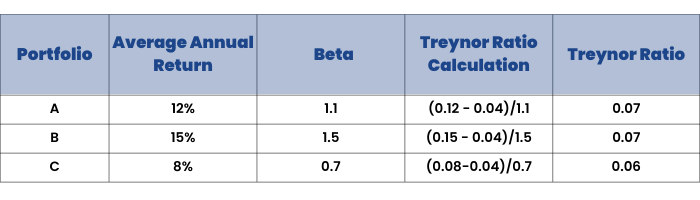
Hence, as per Treynor Ratio, the performance of Portfolios A and B are the same.
A thing to note:
The higher the Treynor Ratio, the better is the portfolio performance.
Jensen’s Alpha
The third most commonly used measure is Jensen's Alpha. It was created by Michael C Jensen and calculated the excess return generated by a portfolio over its expected return. Truly speaking, it measures a portfolio manager’s ability to generate above-average returns, after adjustment of market risk.
Jensen’s alpha calculation:
α = PR – (RFR + β)
Where:
α = Jensen’s Alpha
PR = Portfolio return
RFR = Risk free rate of return
β = Beta
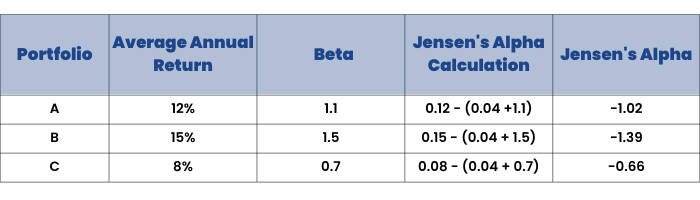
A thing to note:
✔The higher the ratio, the better is the risk-adjusted returns.
✔A portfolio that generates consistently positive excess returns will have a positive alpha. A portfolio that generates consistently negative excess returns will have a negative alpha.
Please note: All the examples provided above are the simplistic representation of the ratios. Of course, situations are much more complex in real life and hence, there can be multiple factors and variables affecting a portfolio. As the factors increase, the calculations will become more complex.


