Profitability Ratios
Now comes the profitability ratios. Similar to what we have learned in the last section about activity ratios which measure the company's operational efficiency, Profitability ratios measure the efficiency of a firm to generate profits for its shareholders.
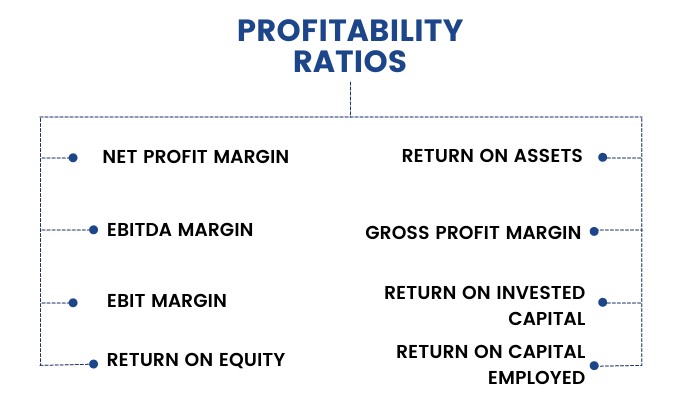
What are Profitability Ratios?
These ratios are most important from the viewpoint of an investor since they show whether the company is making profits and generating adequate returns or not.
1. Gross Profit Margin:
Here gross profit is the difference between sales and cost of goods sold. The gross profit ratio represents the excess of what the concern is able to charge as sale price over the cost of purchasing/manufacturing the goods. Gross profit margin indicates the percentage of revenue available to cover operating and other expenses and to generate profit.
Gross profit margin is an important ratio in evaluating the operating performance of companies, particularly those which are engaged in merchandising and manufacturing business. An analyst should not draw inference by examining the gross profit margin in isolation from other operating expenses.
In general, an increase in gross profit margin signifies better performances than that in the past and higher gross profit margin than that of comparable companies signifies better performance than peer groups.
2. EBIT Margin or Operating Margin:
Here, EBIT is the difference between sales and COGS + SG&A + Depreciation + Amortization. Operating profit margin is the appropriate measure of a company's operating performance and higher the margin signifies better performance by the firm at the operations level.
An operating profit margin increasing faster than the gross profit margin can indicate improvements in controlling operating costs such as administrative overheads. In contrast, a declining operating profit margin could be an indicator of deteriorating control over operating costs.
The operating profit margin of a company that focuses on turnover is likely to be lower than a company that focuses on operating profit margin rather than on turnover. Therefore, in order to draw correct inferences, an analyst needs to understand the business model and corporate strategy of the company.
3. EBITDA Margin:
Here EBITDA is the difference between Sales and COGS + SG&A. We just add back depreciation and amortization to EBIT and the resultant number is EBITDA.
EBITDA is preferred to EBIT for companies operating in sectors like telecom and infrastructure sector which involve very high capital expenditure and in turn high depreciation expenses.
4. Net Profit Margin:
Here Net Profit is the difference between (Sales + Other Income) and COGS+ SG&A+ Depreciation and Amortization + Interest and Taxes.
The profit margin tells you how much profit a company makes for every ₹1 it generates in revenue. Profit margins vary by industry but all else being equal, the higher a company's profit margin compared to its competitors the better it is.
Net profit margin is important from shareholder's perspective. Net profit adjusted for dividend on preference shares represents the surplus that is available for distribution to equity shareholders.
Net profit margin should be based on net income from continuing operations and "below the line" items such as discontinued operations should not be included since the same will not affect the company in the future.
5. Return on Assets (ROA):
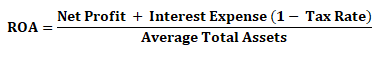
ROA measures how efficiently the management is using its assets to generate earnings.
Since total assets of a company include both debt and equity financing, adding tax adjusted interest back to the net income shows the returns to both equity and debt holders.
ROA tells you what earnings were generated from invested capital (assets). ROA for public companies can vary substantially from industry to industry. This is why when using ROA as a comparative measure, it is best to compare it against a company's previous ROA numbers or the ROA of its peers
The higher the ROA, the better it is because the company is milking more profits from the asset. And when you come to think of it, the management's most important job is to make wise choices in allocating its resources.
6. Return on Equity (ROE):
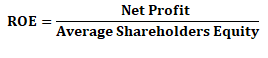
The amount of net income returned as a percentage of shareholders equity. Return on equity measures a corporation's profitability by revealing how much profit a company generates with the money shareholders have invested.
There are several variations of the above formula that investors may use.
- Analysts willing to see the return on common equity may modify the formula above by subtracting preferred dividends from net income and subtracting preferred equity from shareholders' equity giving the following:
Return on common equity = Net Profit - Preferred dividends / Average Common equity
- Investors may also calculate the change in ROE for a period by first using the shareholders' equity figure from the beginning of a period as a denominator to determine the beginning ROE. Then the end-of-period shareholders' equity can be used as the denominator to determine the ending ROE. Calculating both beginning and ending ROE allows an investor to determine the change in profitability over the period.
ROE is often more thoroughly analyzed using the DuPont analysis which is :
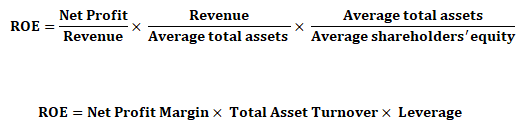
This analysis shows whether the company is increasing its ROE by generating higher profit margins or asset turnover or simply by taking more and more leverage. When a company's ROE increases as a result of the former two then it's a sign of good operating performance however, if it is because of an increase in leverage ratio then it signifies a higher financial risk to the common equity holders.
7. Return on Invested Capital (ROIC):
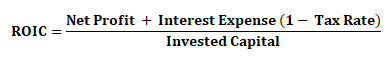
Invested Capital = Net Block+ Capital Work in Progress + Current Assets - Current Liabilities - Cash;
The return on capital measures returns generated on all debt as well as equity invested in an asset/assets. Consequently, it has to consider earnings not just to equity investors (which is net income) but also to lenders in the form of interest payments.
ROIC is one of the most important return measures to consider the operating efficiency of a company because
- A company that earns return on invested capital (ROIC) higher than its weighted average cost of capital (WACC) creates value
- On the other hand, a company that earns ROIC lower than its WACC destroys value
- In a situation of perfect competition, a company cannot earn 'economic rent' which is the return in excess of (WACC)
- A company that manages innovation and product brands well continues to earn returns significantly higher than its WACC.
- Therefore, even in a matured industry, companies which continue to create significant value for their investors exist
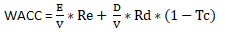
Where,
- Re = Cost of Equity;
- Rd = Cost of Debt;
- E/V = % Share of Equity;
- D/V = % Share of Debt;
- Re = Rf + Beta (Rm- Rf);
- Rf = Risk free rate of return
- Rm = Expected Market Return
- Tc = Corporate Tax Rate
8. Return on Capital Employed (ROCE):
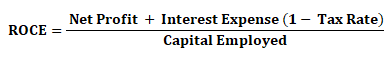
Capital Employed = Fixed Assets + Current Assets - Current Liabilities
ROCE is computed the same as ROIC, the only difference is we do not subtract cash from invested capital. ROCE should always be higher than the rate at which the company borrows otherwise any increase in borrowing will reduce shareholders' earnings.
A variation of this ratio is return on average capital employed (ROACE), which takes the average of opening and closing capital employed for the time.
There are few more important ratios that investors take in consideration while checking the profitability of the company. Kindly check them out–
Let’s calculate Profitability ratios with the given information: -
Company XYZ Ltd.has the following financials:
- Revenue= ₹2,105,700
- Gross Profit= ₹1,055,700
- Operating Income= ₹424,900
- Net Profit= ₹381,800
- EBIT= ₹424,900
- Depreciation= ₹186,000
- Total Shareholder’s equity= ₹1,031,300
1) Gross Profit Margin = Gross Profit/Revenue
= 1,055,700/2,105,700 = 0.50
2) Operating Margin = Operating Income/Revenue
= 424,900/2,105,700 = 0.20
3) EBITDA Margin = EBITDA/Revenue
= (EBIT + Depreciation)/Revenue
= (424,900 + 186,000)/2,105,700 = 0.29
4) Net Profit Margin = Net Profit/Revenue
= 381,800/2,105,700 = 0.18
5) Return on Equity = Net Income/Average Total Equity
= 381,800/1,031,300 = 0.37