
Moving Average Trading Strategy
Firstly, let us start with the moving average strategy. As we all know by now, moving average is a technical indicator that can be extremely helpful in performing swing trades. Let's see how?
Swing traders can use moving average crossovers as strategies to enter trades. They can calculate the average closing price of a share over 20 days, 50 days, 200 days etc. These are known as simple moving averages (SMA) and are represented as a line of the chart. Generally, traders use 20-day SMA, 50-day SMA and 200-day SMA to determine trades.
Whenever a short-term moving average crosses over (cuts from below) a long-term moving average, we call it a golden crossover and take it as a bullish sign to enter the market on the buy side.
Whenever a short-term moving average crosses under (cuts from above) a long-term moving average, we call it a death cross and take it as a bearish sign to enter the market on the sell side.
For Example, if the 20-day SMA cuts the 50-day SMA from below we read it as a sign that the near term trend is turning bullish and prices will rise. Thus, swing traders can buy shares with a view to take profit as price rises.
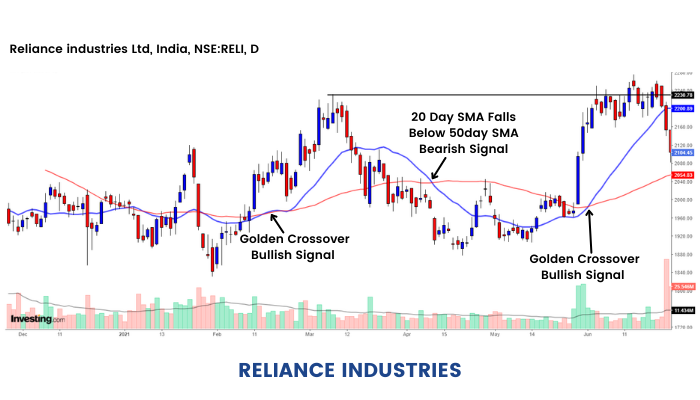
In the above price chart, we see two golden crossovers and one dead crossover.
It will be seen that as 20-day SMA crosses over 50-day SMA there is a spike from ₹1,960 levels to ₹2,225.
This happens again in June when the 20-day SMA crosses 50-day SMA and price rises from ₹1,980 levels to ₹2,300.
Traders on Golden crossover can enter with a view to make profits as the price trend is bullish.
Their view is further strengthened by the fact that the crossover is accompanied by heavy volumes suggesting that there is wider market participation in the trend.
Similarly, at dead crossover, the 20-day SMA falls below the 50-day SMA and we see that prices start falling.
Swing traders could enter at such crossover by selling shares with the expectation that the short-term trend has turned bearish and prices will fall. Ultimately the price did fall from Rs 2040 to Rs 1880 levels.
We can use different combinations of short term and longer term Moving averages too.
A typical textbook-style golden and dead cross crossover can be done by using 50 days and 200-days moving averages. Traders can use either simple or exponential moving averages, whichever suits their trading style.
Enroll Now to our expert-led trading strategy course to learn the markets and maximize your profits today!


