Elearnmarkets - Financial Market Learning
  • Categories
    • Basic Finance
    • Derivatives
    • Financial Planning
    • Fundamental Analysis
    • Technical Analysis
    • Marketshala
    • Miscellaneous
  • Language
    • English
    • Hindi
    • Bengali
No Result
View All Result
  • Courses
  • Webinars
  • Go To Site
  • Login
Elearnmarkets
  • Categories
    • Basic Finance
    • Derivatives
    • Financial Planning
    • Fundamental Analysis
    • Technical Analysis
    • Marketshala
    • Miscellaneous
  • Language
    • English
    • Hindi
    • Bengali
No Result
View All Result
Webinars
Elearnmarkets - Learn Stock Market, trading, investing for Free
No Result
View All Result
Home Technical Analysis Market Analysis
Bank Nifty Hourly Chart

Bank Nifty Closes Above 5 Day High EMA, Bulls Maintain Upper Hand

Elearnmarkets by Elearnmarkets
November 18, 2020
in Market Analysis, Market Updates
Reading Time: 2 mins read
2
238
VIEWS
Share on FacebookShare on TwitterShare on WhatsApp

Bank Nifty opened above its 34DMA (24349 approx) on Monday the 28th of August.

The Index traded in a narrow range of 120 points throughout the day and closed marginally below the 5 Day High EMA of (24358 approx)
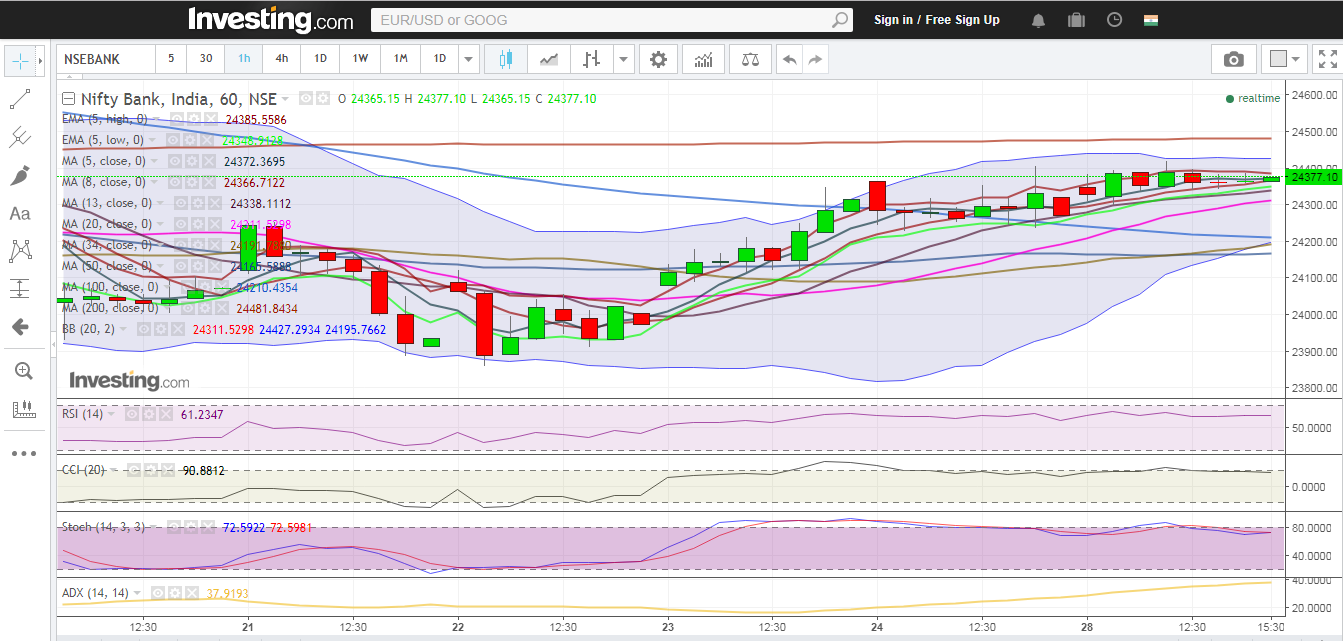
Hourly Technicals:

In the Hourly Chart, Bank Nifty has closed at 24377, below its 5 Hour High EMA of (24377 approx).

The Index is likely to face immediate resistance around the 5 Hour EMA (24385 approx) mark. Bank Nifty has to close convincingly above 34 Hourly MA (24420 approx) before the scales turn in favor of the Bulls.

Hourly RSI and CCI are at the higher end of their normal range.

The hourly ADX too is indicating that Bank Nifty is gradually picking up momentum.

Bank Nifty Hourly Chart

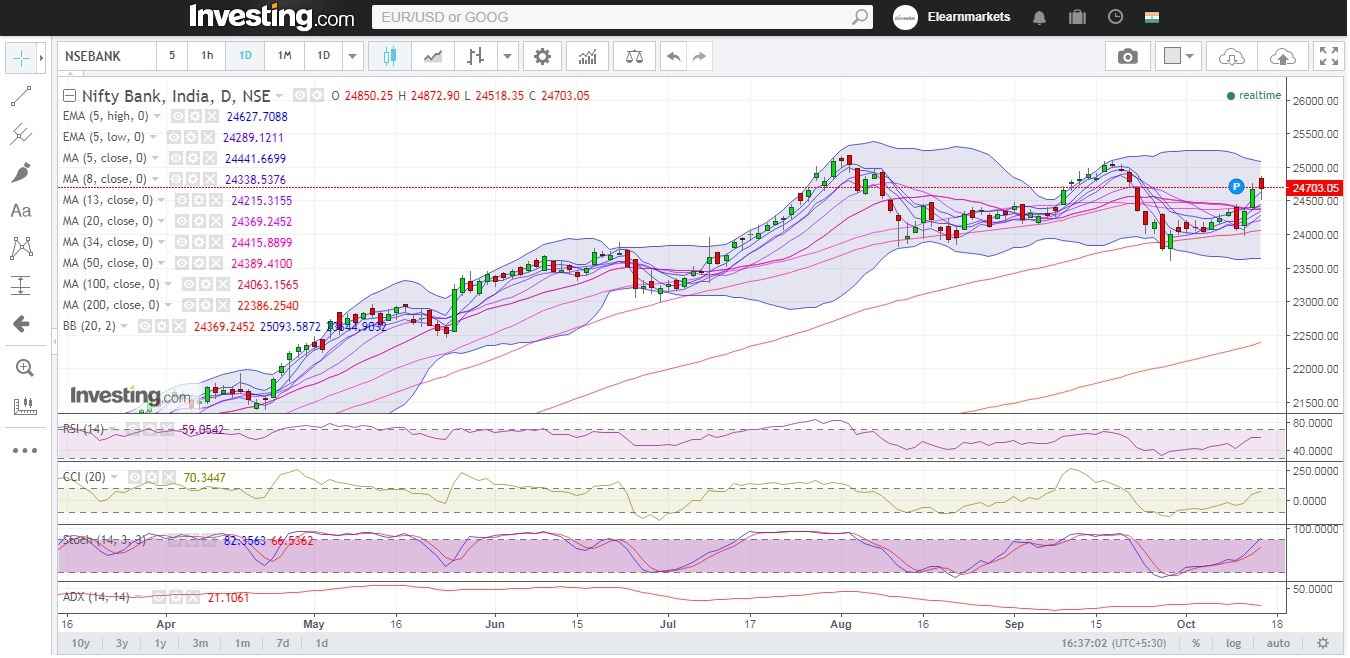
Figure: Hourly Chart

Daily Technicals:

The daily chart indicates that Bank Nifty has closed marginally above the 5 Day High EMA of (24358 approx).

If the Index breaks above the 20 DMA (24471 approx) mark, the next resistance will be 24966.

On the downside, however, if Bank Nifty breaks and closes below its 13DMA (24224 approx), it could find support at the 50DMA area (24047 approx).

While the daily RSI is marginally above its normal range, the CCI indicator has closed slightly below its normal range.

The ADX has closed around its normal range as well.

While the daily RSI is marginally above its normal range, the CCI indicator has closed slightly below its normal range. The ADX has closed around its normal range as well.

Bank Nifty Daily Chart

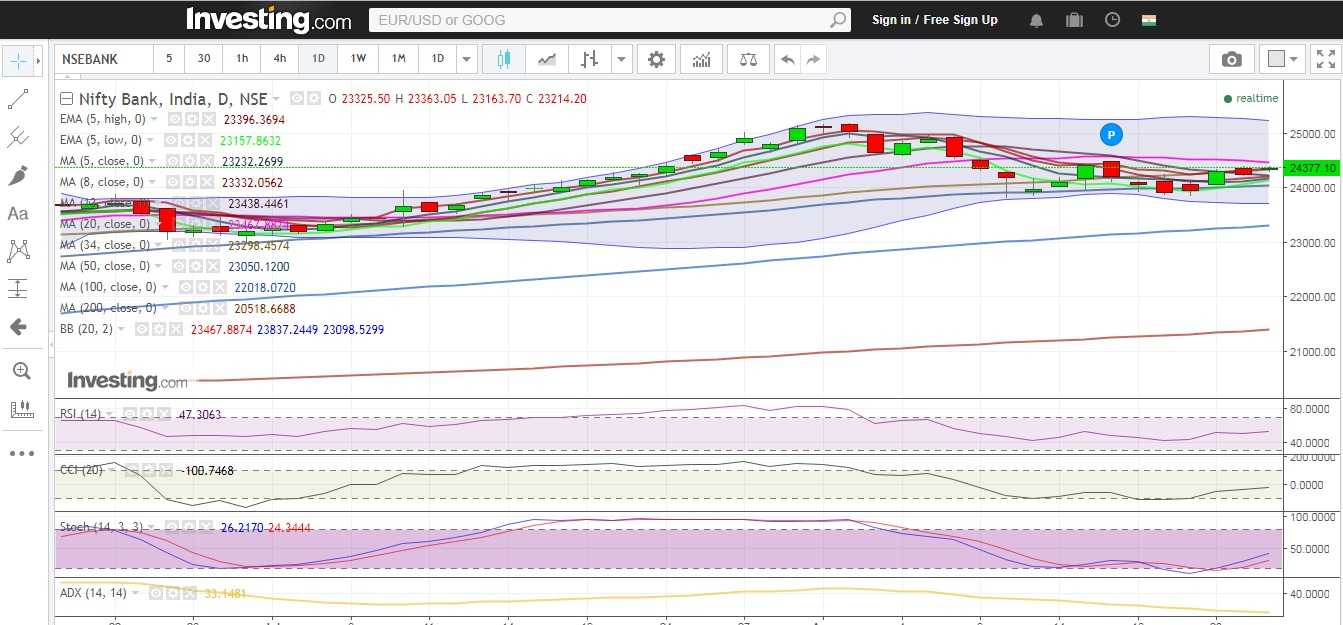
Figure: Bank Nifty Daily Chart

Bank Nifty Tech Table

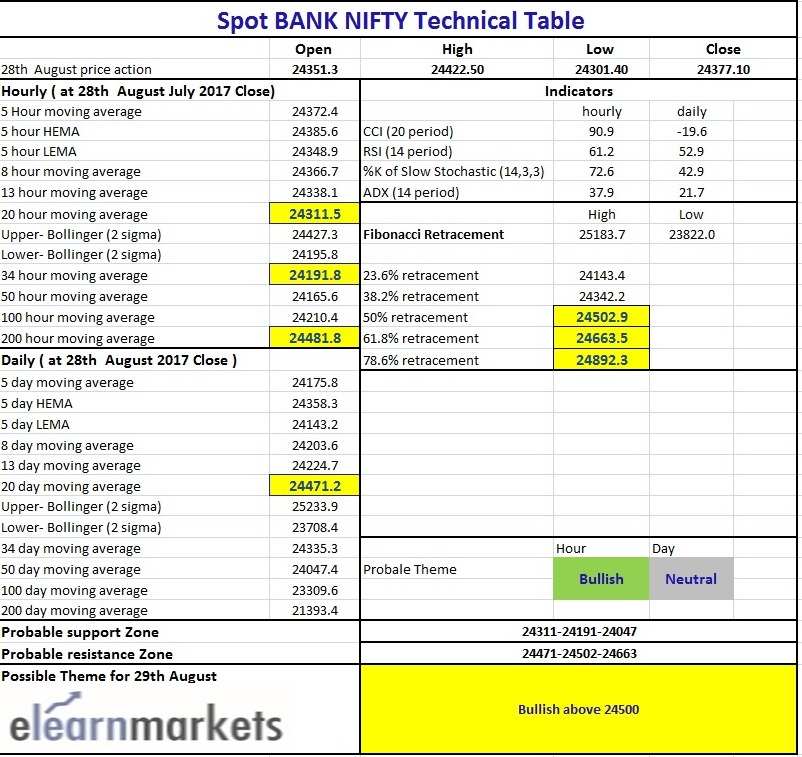
Figure: Bank Nifty Tech Table

Watch the video below to know how to analyze the above matrix:

Tags: english
ShareTweetSend
Subscribe To Updates On Telegram Subscribe To Updates On Telegram Subscribe To Updates On Telegram
Previous Post

Nifty At A Make Or Break Juncture, Closed Above 5 Day High EMA

Next Post

Supertrend Indicator : How to use for Intraday trading?

Elearnmarkets

Elearnmarkets

Elearnmarkets (ELM) is a complete financial market portal where the market experts have taken the onus to spread financial education. ELM constantly experiments with new education methodologies and technologies to make financial education effective, affordable and accessible to all. You can connect with us on Twitter @elearnmarkets.

Related Posts

Hourly Chart
Market Analysis

Nifty Ends on Positive Note, Gains Approx. 475 Points on Positive Global Factors

November 18, 2020
360
Weekly Chart
Market Analysis

Huge Sell-Off Makes the Market Close in a Negative Note on the Expiry Week

November 18, 2020
155
Hourly Chart
Market Analysis

Nifty Ends in Green. Rupee Appreciates and Falling Crude Price Helped the Market to Recover Approx. 140 Point

November 18, 2020
121
Hourly Chart
Market Analysis

Sell Off Continues. Nifty Ends The Week With Three Consecutive Red Candles

November 18, 2020
127

Comments 2

  1. ALOK KUMAR MUKHERJEE says:
    3 years ago

    Very good educational topics. May I know how to go for long/short for avery handsome profits in banknifty options. How we can be sure at what point reversal has to take ina day trading banknifty. Banknifty moves 400 point plus/minus in average

    Reply
    • Sakshi Agarwal says:
      3 years ago

      Hi,

      Thank you for Reading. We do not give any recommendations.

      Keep Reading

      Reply

Leave a Reply Cancel reply

Your email address will not be published. Required fields are marked *

Follow Us

Facebook-f Twitter Instagram Linkedin-in Youtube Telegram

Download App

Register on Elearnmarkets

Continue your financial learning by creating your own account on Elearnmarkets.com

Register Free Account

Get Articles On Email

Enter your email address:

Categories

  • Basic Finance
  • Derivatives
  • Financial Planning
  • Fundamental Analysis
  • Technical Analysis
  • Marketshala
  • Miscellaneous

© 2022 Elearnmarkets . All Rights Reserved

  • Visit Elearnmarkets
  • Courses
  • Webinars
  • Financial Guides
  • Get Free Counselling

Get Elearnmarkets App

No Result
View All Result
  • Article Categories
    • Basic Finance
    • Derivatives
    • Financial Planning
    • Fundamental Analysis
    • Technical Analysis
    • Marketshala
    • Miscellaneous
  • Language
    • Hindi
    • Bengali
    • English
  • Courses
  • Webinars

© 2020 Elearnmarkets All Rights Reserved

Welcome Back!

Login to your account below

Forgotten Password?

Retrieve your password

Please enter your username or email address to reset your password.

Log In

Suggested Learning

Technical Analysis Made Easy

Certification in Online Technical Analysis

Online NSE Academy Certified Capital Market Professional (E-NCCMP)

ELM School

LOVING OUR BLOGS?

Explore more content for free at ELM School.

Start reading & learning from various text-based modules covering all aspects of finance from today!

VISIT ELM SCHOOL