Technical Indicators
Introduction
In this module, we will learn everything about indicators and oscillators used in the study of technical analysis. Technical indicators are mathematical calculations based on historical price, volume, and open interest that aim to forecast the direction of financial securities. So, let us start our journey on learning the several technical indicators mainly used by market experts all over the world.
What are Indicators and Oscillators?
Indicators are mathematical calculations based on the price and the volume of a security that measure factors such as money flow, trends, volatility, and momentum. Indicators are used as a secondary measure to the actual price movements and add additional information to the analysis of securities.
The main uses of technical indicators are:
- It helps us in confirming the price movements and pattern formations on charts.
- It helps us by generating buy and sell signals.
Indicators are used to identify buy and sell signals in technical analysis through crossovers and divergence.
Note: There are also two broad categories of technical indicators that we will learn in the next unit.
Crossovers are the most popular type of indicator and are reflected when either the price moves through the Moving average, or when two different moving averages cross over each other.
Divergences happen when the direction of the price trend and the direction of the indicator trend are moving in opposite directions. This signals to the indicator users that the direction of the price trend is weakening.
Oscillators are those types of indicators that vary over time within a band that may be above and below a center line, or between levels. They are range-bound, for example, between zero and 100, and have signal periods where the security is overbought (near 100) or oversold (near zero). Some of the examples of oscillators are MACD, ROC, RSI, and CCI.
Indicators that are used in technical analysis provide an extremely useful source of additional information. These Indicators help identify momentum, trends, volatility, and various other aspects in a security to aid the technical analysis of trends. It is important to note that while some traders use a single indicator solely for buy and sell signals, these are best used in conjunction with price movement, Chart Patterns, and other Indicators.
Some of the Technical Analysis Indicators:
Moving averages: One of the most common and familiar trend-following indicators is the moving average. They smooth a data series and make it easier to spot trends, something that is especially helpful in volatile markets. They also form the building blocks for many other technical indicators and overlays.
Relative Strength Index (RSI): RSI is a momentum oscillator generally used in sideways or ranging markets where the price moves between support and resistance levels. It is one of the most useful technical tools employed by many traders to measure the velocity of directional price movement.
Bollinger Bands: Bollinger Bands are trading bands developed by John Bollinger. It consists of a 20-period simple moving average with upper and lower bands. The upper band is 2 standard deviations above the moving average, and similarly, the lower band is 2 standard deviations below the moving average. This makes these bands more dynamic and adaptive to volatility.
Money Flow Index: The Money flow index takes into account volume action and, on the basis of volume action; it attempts to measure the strength of money flowing in and out of the security, which nowadays is also known as the smart money flow indicator.
Though we have discussed a few popular technical indicators in the above section, these are not all. There are thousands more, so before we dig deep into the module, let us first divide these indicators into broad categories. What are those? We will discuss them in the next unit.
Leading Vs Lagging Indicators
There are two main types of Indicators:
1. Leading Indicators:
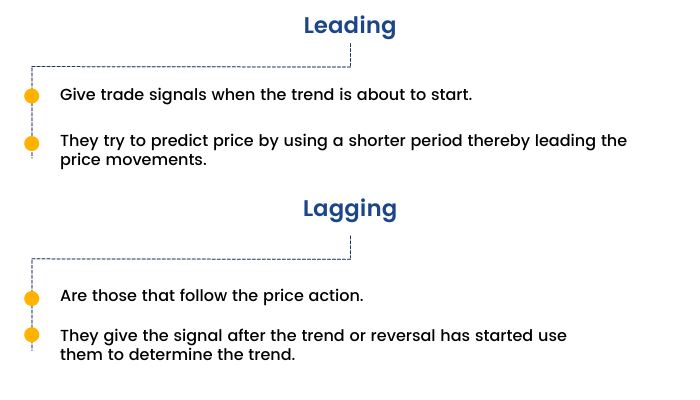
A leading Indicator is a type of indicator that precedes price movements, giving it a predictive quality. It is thought to be the strongest during periods of sideways or non-trending trading ranges. A leading indicator is a tool designed to anticipate the future direction of a market in order to enable traders to predict market movements ahead of time.
2. Lagging Indicators:
A lagging Indicator is a confirmation tool because it follows price movement. It is still useful during trending periods. It follows an event. These types of indicators work well when the prices are moving in long trends. They don’t signal upcoming changes in prices but simply tell whether the prices are increasing or decreasing. Many people prefer to choose lagging indicators as it helps them to trade with more confidence by validating their results.
Moving Averages and Moving Average Convergence and Divergence (MACD) are examples of lagging indicators. We will discuss more about moving averages and MACD technical indicators going forward in this module.
The most obvious difference is that leading indicators predict market movements, while lagging indicators confirm trends. Both leading and lagging indicators have their own pros and cons, so it is important for you to decide which indicator to use according to the strategy.
Types of indicators
We have briefly discussed the concept of indicators & oscillators previously, but there are several broad categories of technical indicators that we will go through in this section. So let's start:
Indicators and oscillators can be classified into four broad categories. They are as follows:
- Trend Following Indicators
- Momentum Indicators
- Volatility Indicators
- Volume Indicators
Let us understand the characteristics of each one of them in detail:
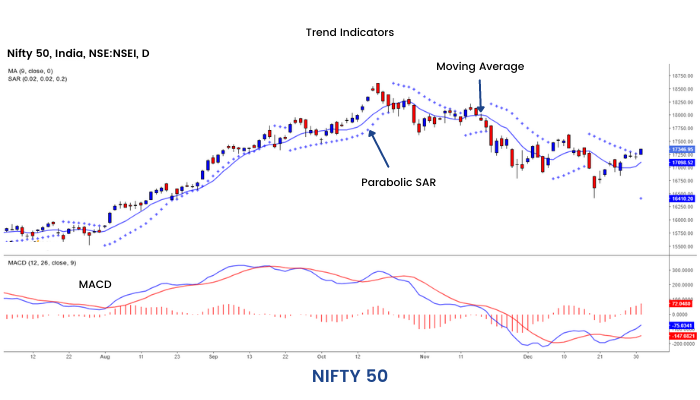
1. Trend Indicators
These types of indicators indicate the direction of the trend. For example, in the moving average, price data is smoothed, and the trend is represented as a single line. Due to this smoothing process, these types of indicators tend to lag price changes and are called trend-following indicators. Some of the trend-following indicators are Moving Average, MACD, ADX, Parabolic SAR, etc.
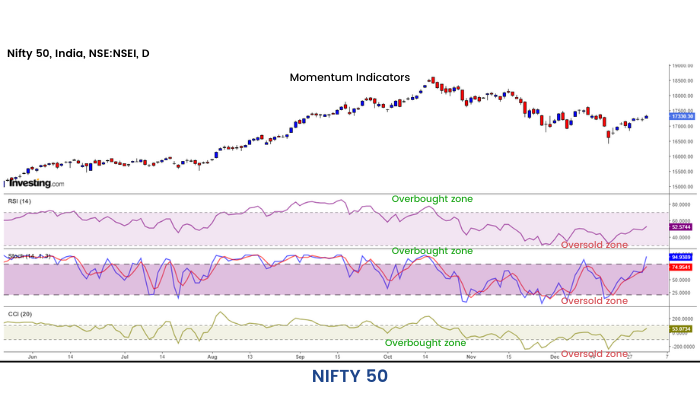
2. Momentum Indicators
Momentum measures motion. Momentum indicators are technical analysis tools used to determine the strength or weakness of a stock's price. Although their main use is to indicate the strength of a trend, momentum indicators also indicate when a trend has slowed and is possibly ready for a change. Some of the momentum indicators are Stochastic, RSI, ROC, William % R, CCI, etc.
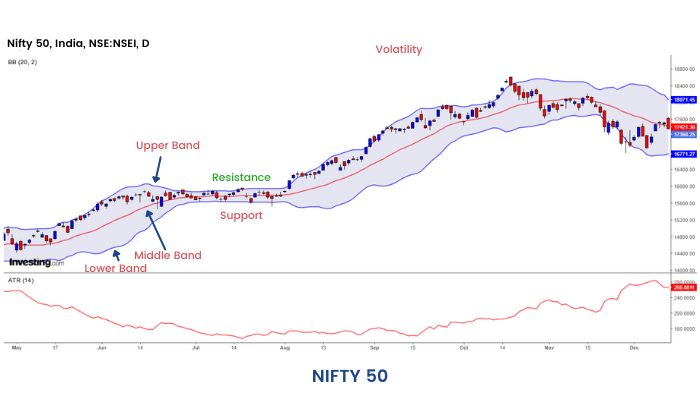
3. Volatility Indicators
These are technical analysis tools that look at the changes in market prices over a specific period of time. The faster prices change, the higher the volatility, and similarly, the slower prices change, the lower the volatility. Some of the volatility indicators are Average True Range, Bollinger Band, etc.
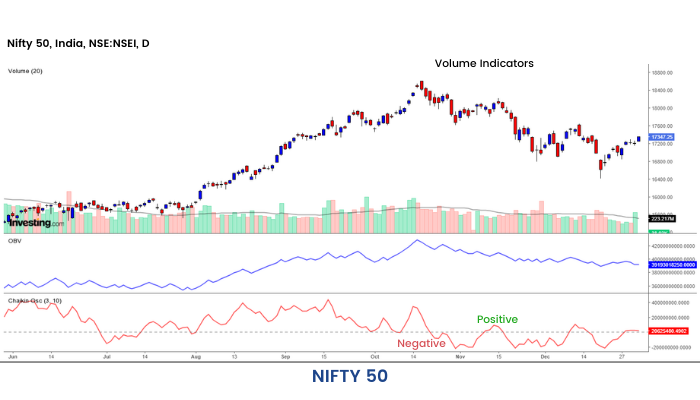
4. Volume Indicators
Volume measures the total number of stocks traded at a particular point in time. It is a very powerful tool to evaluate a security's bull and bear power. A high volume indicates strong buying pressure, which pushes the indicator higher and vice versa. Some popular volume indicators are the Chaikin oscillator, OBV, etc.
Moving Averages
First, let us understand the 'Moving averages,' one of the most popular types of indicators in technical analysis.
What are moving averages?
Chart patterns usually show a lot of variation in price movement. This can make it difficult for traders to get an idea of a security's overall trend. One simple method traders use to combat this is to apply moving averages. A Moving Average is the average price of a security over a set period of time. By plotting a security's average price, the price movement is smoothed out. Once the day-to-day fluctuations are removed, traders are better able to identify the true trend and increase the probability that it will work in their favour.
Example: For a 5-day Moving Average, you simply add the closing prices of the last five closings and divide this sum by 5. For each consecutive day, you add the new closing price and skip the oldest. Thus, the number of closing prices considered always remains constant at 5 days. One of the most common and familiar trend-following indicators is the moving average. They smooth a data series and make it easier to spot trends, something that is especially helpful in volatile markets. They also form the building blocks for many other technical indicators and overlays.
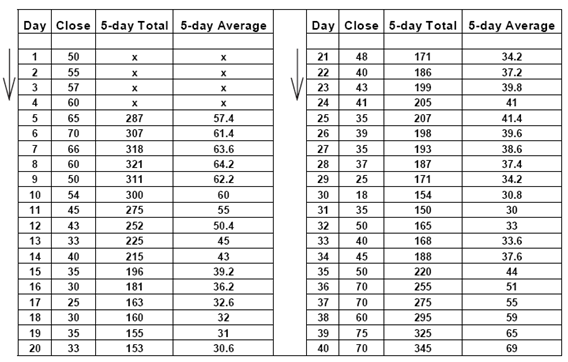
However, whether you choose a 10-day average or a 40-week average, the method of calculation is the same; instead of adding 5 days, you add the closing prices of 10 days or 40 weeks and divide the sum by 10 or 40, respectively.
What are the different types of Moving Averages?
Simple moving average (SMA)
A simple moving average is formed by computing the average (mean) price of a security over a specified number of periods. It places equal value on every price for the time span selected. While it is possible to create moving averages from the Open, High, and Low data points, most moving averages are created using the closing price.
For example: A 5-day simple moving average is calculated by adding the closing prices for the last 5 days and dividing the total by 5.
Exponential moving average (EMA)
Exponential moving average, also called exponentially weighted moving average, is calculated by applying more weight to recent prices relative to older prices. In order to reduce the lag in simple moving averages, technicians often use exponential moving averages. The weighting applied to the most recent price depends on the specified period of the moving average. The shorter the EMA’s period, the more weight is applied to the most recent price. For example, a 10-period exponential moving average weighs the most recent price 18.18% while a 20-period EMA weighs the most recent price 9.52%.
Exponential moving average calculation
Exponential Moving Averages can be specified in two ways - as a percent-based EMA or as a period-based EMA. A percent-based EMA has a percentage as its single parameter, while a period-based EMA has a parameter that represents the duration of the EMA.
The formula for an exponential moving average is:
EMA = Closing price x multiplier + EMA (previous day) x (1-multiplier)
Trading with Moving Averages
Now that we have an understanding of the concept of moving averages from the last unit, let us discuss how moving averages are used in technical analysis.
What are the uses of Moving Averages?
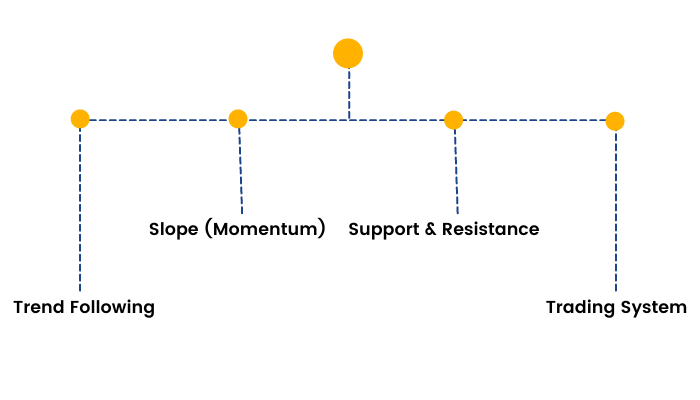
The following are some of the major uses of Moving Averages:
1. To identify support and resistance levels.
2. To quickly identify whether a security is moving in an uptrend or a downtrend depending on the direction of the moving average. When a Moving Average is heading upward and the price is above it, the security is in an uptrend. Conversely, a downward-sloping moving average with the price below it can be used to signal a downtrend.

3. Moving Averages also tell us the trend order. When a short-term average is above a longer-term average, the trend is up. On the other hand, a long-term average above a shorter-term average signals a downward movement in the trend.
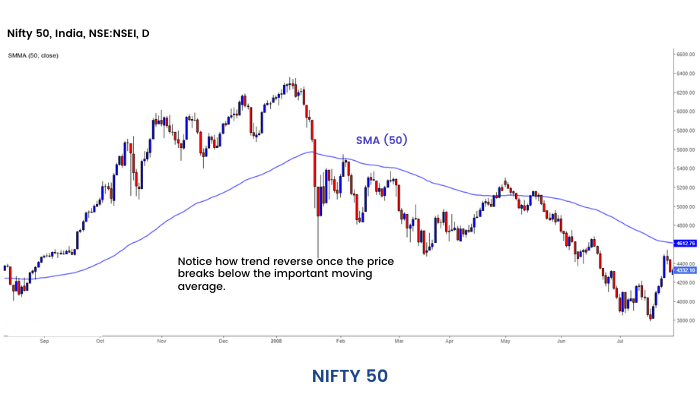
4. Moving Average also helps in confirming the trend reversals. When the price moves through a Moving average, or there is a moving average crossover, it indicates a trend reversal.
For example, when the price of a security that was in an uptrend falls below a 50-period moving average, it is a sign that the uptrend may be reversing.
5. Moving Averages help technical traders to smooth out some of the noise that is found in day-to-day price movements, giving traders a clearer view of the price trend.
Which time period Moving Average should we use?
A moving average is a powerful tool for analyzing the trends in a security. We know that trends should always be specified with a timeframe.
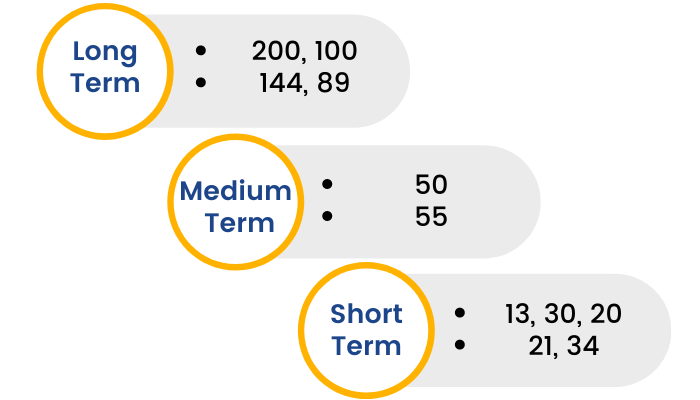
Trends can be classified into:
- Long-term trend: To depict the long-term trend, traders use a 200-period or 100-period moving average. However, many traders also use 144 or 89 period moving averages to identify long-term trends.
- Medium-term trend: To depict the Medium-term trend, traders normally use a 50 or 55 period Moving average.
- Short-term trend: To depict the short-term trend, traders use 13, 20 and 30 period Moving average. However, many traders also use the 21 and 34 period moving averages to identify short-term trends. Normally, a 13 and 30 moving average crossover for trend signals is used by many traders. To determine the trend order, 13, 21, and 34 are most commonly used.
BUY and SELL signals are given
- When the price crosses the moving average
- When the moving average itself changes direction and
- When the moving averages cross each other
Moving averages are popular types of indicators. However, it is a vast concept. It is briefly discussed in this section. But that's not enough! We have created a separate module only on Moving Averages. Follow this link to find out more.
RSI Hidden Bullish Divergence
Previously, we mentioned that Moving Average Convergence and Divergence (MACD) is a popular lagging indicator. Now we will learn the MACD indicator, but before we begin, it is essential to understand the concept of 'Divergence' that we will learn here in this section. So let us get started.
Divergence occurs when the price of the stock and the indicator are moving in opposite directions. They do not match each other.
Elevate your trading game with our exclusive Technical Analysis Course. Enroll now to decode market trends and maximize your profits!
What is Positive and Negative Divergence?
Negative divergence occurs when the price is in an uptrend, and an indicator like the moving average convergence divergence (MACD), price rate of change (ROC), or relative strength index (RSI) moves downward. It is a condition where Price makes higher tops and higher bottoms, whereas Indicators fail to do so. They make lower tops and lower bottoms.
Positive divergence occurs when the price is in a downtrend, but the indicator starts to rise. It is a condition where Price makes lower tops and lower bottoms, whereas Indicators fail to do so. They make higher tops and higher bottoms. These are usually reliable signs, as they predict prices are going to reverse.

What is Hidden Divergence?
We can understand it by understanding the difference between the regular and hidden divergence.
Regular divergence is a trend reversal signal, whereas hidden divergence is a trend continuation signal.
Hidden Bullish Divergence
- During an uptrend.
- Once the price makes a higher Low, but the oscillator makes a lower Low.
- The trend should continue to the upside.
Hidden Bearish Divergence
- During a downtrend.
- Once the price makes a lower high, but the oscillator makes a higher high
- The trend should continue to the downside.
Difference between Regular and Hidden Divergence:
Hidden divergence mainly signals the continuation of the trend, whereas regular divergence signals trend reversals.
Suppose the trend of the stock is upward, but the prices have started falling, whereas the RSI is making a higher high, then a trader can spot this as a positive hidden divergence, and may increase their quantity by buying on the dip.
Now, the prices are increasing, but suddenly RSI starts making a lower low, then the trader should become cautious as a bearish regular divergence is being made, and there could be a price reversal.
Moving Average Convergence and Divergence (MACD)
Now that we fully comprehend the concept of divergence. Let's discuss the MACD indicator.
What is a MACD indicator and what can it reveal?
Moving Average Convergence Divergence (MACD) is a technical analysis indicator that basically measures the distance between two moving lines. MACD is a type of indicator that is a hybrid of a trend-following indicator and a trend-identifying indicator.
How is MACD calculated?
The MACD comprises two lines. Fast line and the slow or signal line. The Slow line is easy to identify as it will be smoother than the fast line.
Step 1. Calculate a 12-period exponential moving average of the closing price.
Step 2. Calculate a 26-period exponential moving average of the closing price.
Step 3. Subtract the 26-period moving average from the 12-period moving average. This is the fast MACD line.
Step 4. Calculate a 9-period exponential moving average of the fast MACD line calculated above. This is the slow or signal MACD line.
Uses of the MACD indicator:
MACD generates signals from three main sources:
- Moving average crossover
- Centerline crossover
- Divergence
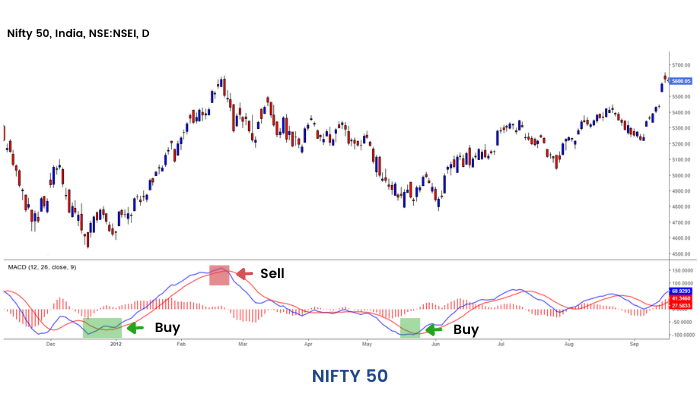
Crossover of fast and slow lines
The MACD proves the most effective signal in wide-swinging trading markets. We will first consider the use of the two MACD lines. The signals to go long or short are provided by a crossing of the fast and slow lines. The basic MACD trading rules are as follows:
- Go long when the fast line crosses above the slow line.
- Go short when the fast line crosses below the slow line.
These signals are best when they occur some distance above or below the reference line. If the lines remain near the reference line for an extended period, as usually occurs in a sideways market, then the signals should be ignored.
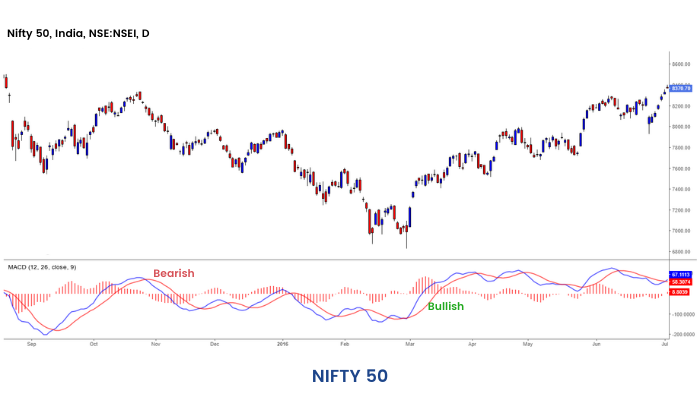
Center line crossover
A bullish centerline crossover occurs when MACD moves above the zero line and into positive territory. This is a clear indication that momentum has changed from negative to positive or from bearish to bullish. After a positive divergence and bullish moving average crossover, the centerline crossover can act as a confirmation signal. Of the three signals, moving average crossover is probably the second most common signal.
A bearish centerline crossover occurs when MACD moves below zero and into negative territory. This is a clear indication that momentum has changed from positive to negative or from bullish to bearish. The centerline crossover can act as an independent signal or confirm prior signals such as a moving average crossover or negative divergence. Once MACD crosses into negative territory, momentum, for the short term, is expected to be bearish.
Divergence
An indication that an end to the current trend may be near occurs when the MACD diverges from the security. A positive divergence occurs when MACD begins to advance, and the security is still in a downtrend and makes a lower reaction low. MACD can either form as a series of higher lows or a second low that is higher than the previous low. Positive divergences are probably the least common of the three signals, but are usually the most reliable and lead to the biggest moves.
A negative divergence forms when the security advances or moves sideways and the MACD declines. The negative divergence in MACD can take the form of either a lower high or a straight decline. Negative divergences are probably the least common of the three signals, but are usually the most reliable and can warn of an impending peak.
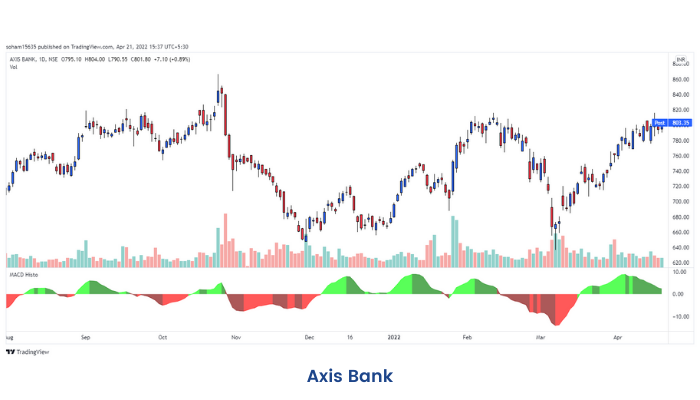
MACD Histogram
In earlier units, we have learned the concept of divergence and the MACD indicator. Moreover, there is another theory related to MACD, i.e., the MACD histogram.
What is a MACD Histogram?
MACD Histogram was developed in 1986 by Thomas Aspray. It bridges the time gap between the price movement and MACD. It also offers a deeper insight into the balance of power between so-called bulls and bears than the original MACD.
A histogram is one of the best tools available to a chartist because it shows not only who has control over the market but also the magnitude of strength, and provides a MACD trading strategy that works. It measures the distance between MACD and its Signal Line, which is the 9-day EMA of MACD.
MACD Histogram = MACD Line – Signal Line
The difference is represented by vertical lines or by bars in a series. The interesting fact is that, like MACD, MACD-Histogram also fluctuates above and below the zero line. Hence, it is also known as an “oscillator".
If the fast line is above the slow line, the MACD-Histogram is positive and plotted above the zero line. On the other hand, if the fast line is below the slow line, the MACD-Histogram is negative and plotted below the zero line. Interestingly, when the two lines touch, the MACD Histogram equals zero. The magnitude of height is directly proportional to the spread between the MACD and the Signal Line.
Relative Strength Index (RSI)
While discussing some popular types of indicators earlier, we briefly described the RSI indicator. Now, in this section, let us elaborate on the concept and learn how to use the RSI indicator as a tool in technical analysis.
What is the RSI indicator?
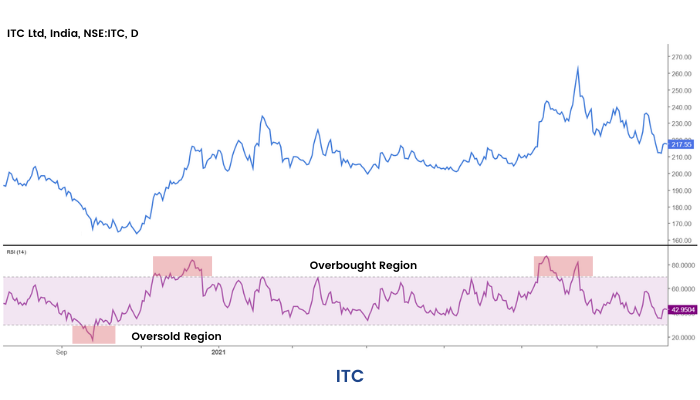
The Relative Strength Index (RSI) is a momentum indicator developed by renowned technical analyst Welles Wilder that compares the magnitude of recent gains and losses over a specified time period to measure the speed and change of price movements of a security. It is primarily used to attempt to identify overbought or oversold conditions in the trading of an asset.
The overbought region refers to the case where the RSI oscillator has moved into a region of significant buying pressure relative to the recent past and is often an indication that upward trend momentum may slow down. Similarly, the oversold region refers to the lower part of the momentum oscillator where there is a significant amount of selling pressure relative to the recent past.
The RSI is a price-following oscillator that ranges between 0 and 100. Generally, technical analysts use 30 oversold and 70 overbought lines to generate the buy and sell signals.
- Go long when the indicator moves from below to above the oversold line of 30.
- Go short when the indicator moves from above to below the overbought line of 70.
Note here that the direction of crossing is important; the indicator needs to first go past the overbought/oversold lines and then cross back through them. The overbought and oversold regions are shown in the chart below:
The other means of using RSI is to look at divergences between price peaks/troughs and indicator peaks/ troughs. If the price makes a new higher peak, but the indicator does not make a corresponding higher peak, this indicates there is less power driving the new price high. The momentum behind the price rise is low. Since there is less power or support for the new higher price, a reversal could be expected.
Similarly, if the price makes a new lower trough but the momentum indicator does not make a corresponding lower trough, then it can be surmised that the downward movement is running out of strength and a reversal upward could soon be expected.
This is illustrated in the chart below.
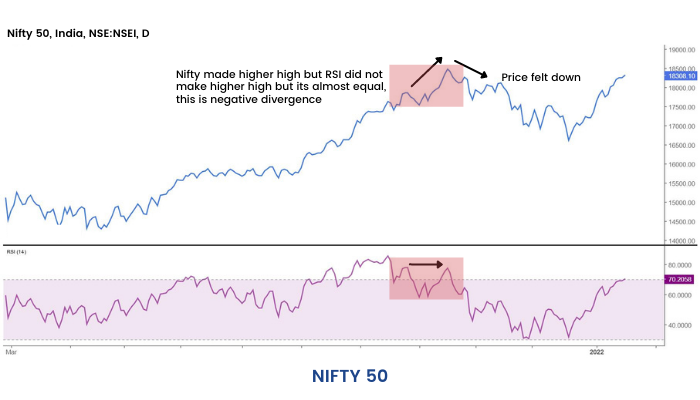
A bullish divergence represents upward price pressure, and a bearish divergence represents downward price pressure.
How is the relative strength index calculated?
The relative strength index is calculated using the following formula:
RSI=100−100/(1+RS)
Where RS = Average gain of up periods during the specified time frame / Average loss of down periods during the specified time frame.
The RSI provides a relative evaluation of the strength of a security's recent price performance, thus making it a momentum indicator.
RSI values range from 0 to 100. The default time frame for comparing up periods to down periods is 14, as in 14 trading days. However, if you are using RSI on weekly charts, a 5- period RSI is recommended compared to a 14-period RSI.
Channel Commodity Index (CCI)
The next type of indicator we will learn in this unit is the ‘Channel Commodity Index’ (CCI).
The CCI indicator (oscillator) developed by Donald Lambert is a versatile and widely used indicator in technical analysis, which helps in identifying overbought and oversold conditions, reversals, and divergences. It also helps in taking momentum-based trades.
In momentum-based trading, traders mostly focus on stocks that are giving significant moves in one direction on high volumes.
Momentum-based traders may hold their positions on varying time frames, including several minutes, a few hours, or even the full trading day, based on how quickly the stock moves in case of a directional change.
CCI is a versatile momentum oscillator developed by Donald Lambert that can be used to identify overbought (+100) / oversold (-100) levels or trend reversals
Calculation:
CCI = (Typical Price- 20-period SMA of typical price)/ (.015*mean deviation)
Where typical price= (High + Low + Close)/ 3m and 0.015 is used as a constant. Basically, the constant of 0.015 makes sure that 70- 80 percent of CCI values fall between -100 and + 100.
How to trade using CCI?
The CCI can be used as a coincident or leading indicator. As a coincident indicator, any move after 100 indicates a strong price uptrend and the beginning of an uptrend.
While any move to -100 suggests weakness and the beginning of a downtrend. The trend line break of the CCI is also keenly observed by the traders.
However, a leading indicator trader also uses it to find bullish and bearish divergence to identify overbought and oversold positions and reversals in trends.
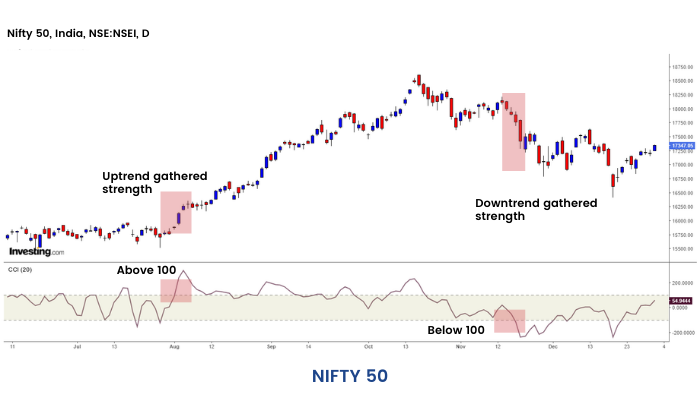
CCI mainly moves between the range of -100 and 100.
One should enter the stock when this indicator crosses 100, as it indicates a buy signal, and exit the stock when this indicator crosses -100, as it indicates a sell signal.
RSI Vs CCI
In our previous units, we have learned two types of indicators, RSI and CCI. Here in this section, let us discuss the differences between the two and find out which one is better.
Which is better: Relative Strength Index (RSI) or Commodity Channel Index (CCI)?
Relative Strength Indicator (RSI) is a type of indicator that is used as a momentum indicator. It is used to compare the magnitude of recent gains and losses over a specified time period to measure the speed and change of price movements of a security.
The Commodity Channel Index (CCI) is a momentum-based technical trading tool used most often to help determine when an investment vehicle is reaching a condition of being overbought or oversold.
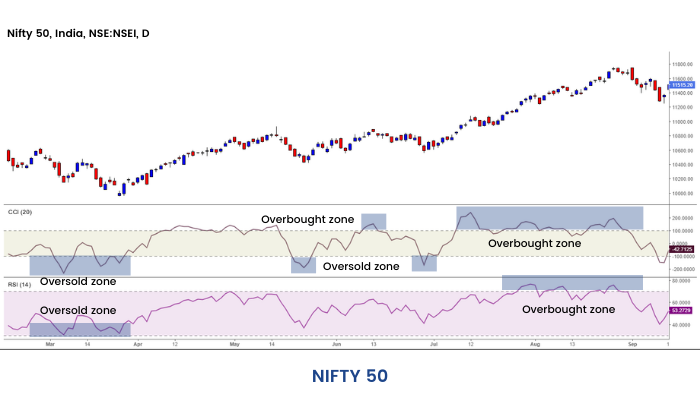
Commodity Channel Index (CCI) and Relative Strength Index (RSI) are both Momentum Indicators which shows oversold and overbought regions.
The default setting of RSI is 14, while the default setting of CCI is 20. CCI shows the overbought and oversold regions more often than RSI.
This NSE daily chart shows us that CCI is indicating more overbought and oversold regions as compared to RSI.
Stochastic Indicator
In this section, we will learn about a new type of indicator known as 'Stochastic.'
What is a Stochastic Indicator?
The Stochastic indicator was developed by George Lane. It is a technical analysis indicator that compares where a security’s price closes over a selected number of periods. Most traders use the 14-period stochastic.
Stochastic Indicator Formula:
It is calculated using the following formula- %K = 100[(C – L14) / (H14 – L14)]
Where,
C = the recent closing price
H14 = the highest price traded during the same 14-day period.
L14 = the low of the 14 previous trading sessions
Interpretation
A %K of 80 implies that the security’s price is above 80% of the price range (high – low) of the last 14 days. The assumption here is that security’s price will remain at the top of the range in a strong uptrend.
The other line, i.e., the %D line, is a three-period moving average of the %K line, which acts as a signal line.
Whenever the %K line crosses the %D line, it generates a trading signal.
Normally, a period of 14 days is used for the above calculation, but the traders often modify it to 5 or 9 according to their trading strategies.
Slow vs Fast Stochastic Indicator
There is a concept of fast and slow stochastic, and the difference basically lies in terms of sensitivity.
The % D line in fast Stochastic is a 3-period moving average of the % K line.
This % D line of fast Stochastic is taken as % K line of slow Stochastic, the %D line in slow Stochastic is a 3-period moving average of this line.
The fast Stochastic is more sensitive than the slow Stochastic to a change in the price of the underlying security, and it will result in a greater number of trading signals than the slow Stochastic.
In the following picture, we have plotted both the slow and fast Stochastic for WTI Crude Oil.

Bullish and Bearish Divergence
Apart from identifying overbought and oversold zones, another very important use of the Stochastic Oscillator is divergence, and it plays a very important role in identifying reversals.
A bullish divergence is seen when the price makes a lower low while the stochastic makes a higher low. This shows that the downside momentum is weakening, and at any time, there can be a reversal on the upside. A bullish divergence is confirmed when the price action becomes bullish along with a stochastic continuing uptrend.

On the other hand, a bearish divergence is formed when the price makes a higher high, but the stochastic makes a lower high. It suggests that the upside momentum is limited, and at any time, there could be a reversal on the downside. The confirmation of bearish divergence comes when the price action becomes bearish, and the stochastic continues to downtrend.

The momentum oscillators work very well in the trading market, but they can be used in the trending market as well. Many times, the Stochastic Indicator gives a crossover before reaching the 20 or 80 line, and this crossover in the middle is strong confirmation of a change in the short-term trend. The accuracy of its findings makes it one of the favorite indicators amongst the technicians.
Bollinger Bands
The next type of indicator that we will learn in this unit gauges the volatility of the stock, known as 'Bollinger Bands'
Bollinger Bands were developed by John Bollinger. It consists of the center line and two price bands. The center line is the 20-day moving average, and the two trading bands are the price volatility bands. The two outer bands are plus and minus 2 standard deviations.
How to master Bollinger Bands?
Bollinger Bands are volatility bands placed above and below a moving average. Volatility is the degree of variation of a trading price series over time, as measured by the standard deviation of returns.
The bands automatically widen when volatility increases and narrow when volatility decreases.
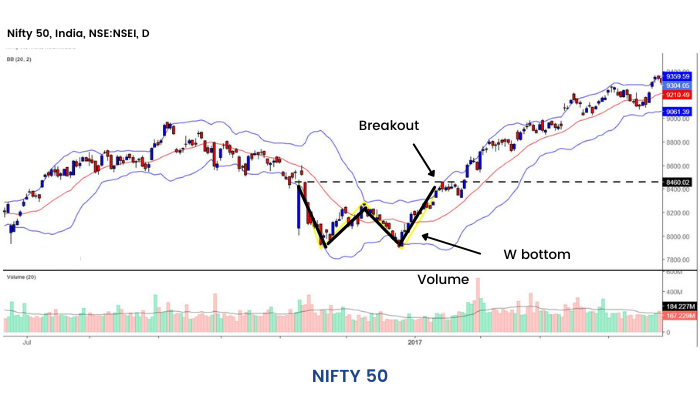
W-Bottom
A "W-Bottom" forms in a downtrend and involves two reaction lows. In particular, Bollinger looks for W-Bottoms where the second low is lower than the first, but holds above the lower band
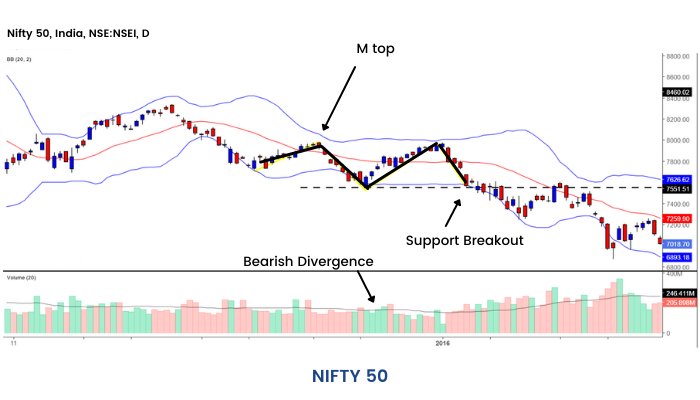
M-Top
An M-Top is similar to a double top. However, the reaction highs are not always equal. The first high can be higher or lower than the second high. Bollinger suggests looking for signs of non-confirmation when a security is making new highs
Trading Strategies:
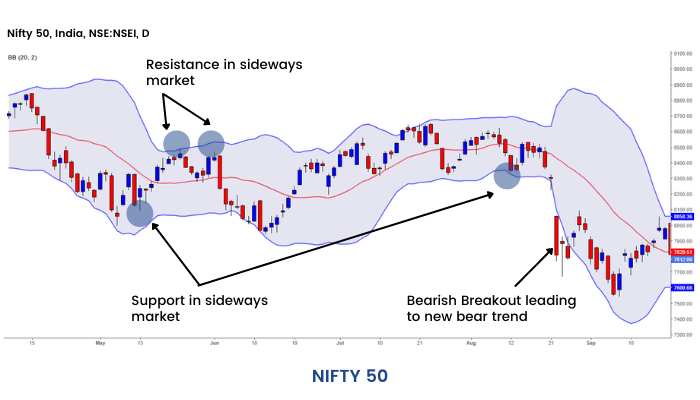
Overbought and Oversold strategy
This is a common strategy when we trade with Bollinger Bands. This strategy is used in the trading range market to identify overbought and oversold regions in the current market conditions. When the price of the stock or index breaks below the lower band, then the trader can buy, expecting the price to return to the middle band. Similarly, when the price of the stock or index breaks above the upper band, the trader can sell, expecting the price to return to the middle band. This strategy cannot be used in strong trending markets.
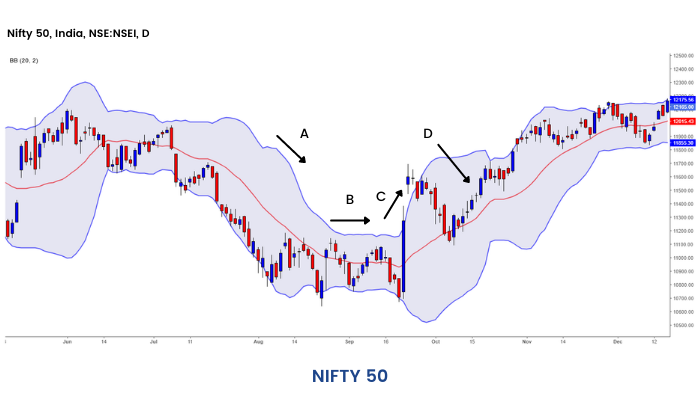
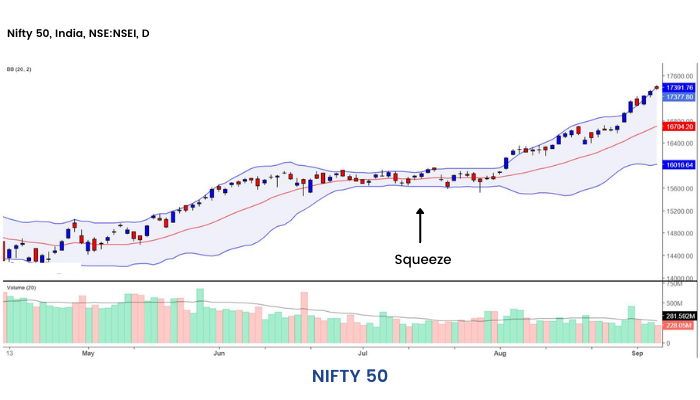
Bollinger Bands Squeeze Strategy
This is another strategy that can be used while trading with Bollinger Bands. A squeeze is formed when the prices move sideways in the consolidation.
When the prices move in consolidation, the upper and lower bands come close to each other. This means that the volatility of the stock has decreased. This may not be the case always, and the volatility of the stock will tend to increase again after a certain period of time. The prices make a large move in either direction after the consolidation. An increase in the volume on a breakout is a sign that the stock is no longer in consolidation and it is going to form an uptrend or downtrend.
When the price breaks the upper or lower band, then the trader can buy or sell accordingly.
On-Balance Volume
Next, we will learn about a volume-based type of indicator known as On-Balance Volume (OBV).
What is On-Balance Volume?
Volume is one of the simplest tools that help to identify big moves in the stock market. Let us understand the importance of Volume and how to trade with it.
According to this theory, the volume is correlated with the change in price. On Balance Volume (OBV) actually measures buying and selling pressure on a cumulative basis, which subtracts volume on down days and adds volume on up days.
1. If today's closing price is higher than yesterday's closing price, then: Current OBV = Previous OBV + today's volume
2. If today's closing price is lower than yesterday's closing price, then: Current OBV = Previous OBV - today's volume
3. If today's closing price equals yesterday's closing price, then: Current OBV = Previous OB
On Balance Volume was developed by Joe Granville, and it is one of the first indicators to measure positive and negative volume flow. People often use OBV to confirm price trends and also look for divergence between price and OBV.
How to get an advanced trading signal using OBV?
On Balance Volume (OBV) actually measures buying and selling pressure on a cumulative basis, which subtracts volume on down days and adds volume on up days.
CALCULATION
1. If the closing price is above the prior close price, then: Current OBV = Previous OBV+ Current Volume
2. If the closing price is below the prior close price, then: Current OBV= Previous OBV - Current Volume
3. If the closing price equals the prior close price, then: Current OBV= Previous OBV (no change)
How to trade using OBV?
ADVANCED BREAKOUT

This is a situation where the price could not breach the previous top, but the OBV line has breached the previous top.
ADVANCED BREAKDOWN

This happens when the price has failed to break the previous bottom, whereas On Balance Volume has broken the previous bottom.
Money Flow
Finally, the last type of indicator that we will learn in this section is the Money Flow Index.
What does "money flow" mean in stock trading?
Price and volume are essential indicators in technical analysis for predicting price movement.
For tracking the price and volume data, you may use the Money Flow Index (MFI).
MFI identifies the momentum of outflow and inflow of money of a stock over a specific period of time and is one of the popular technical tools.
Trading strategy using Money Flow Index
MFI is a momentum oscillator that identifies the momentum of outflow and inflow of money of a stock over a given time period.
It is also known as a volume-weighted version of RSI. However, the main difference in MFI is about volume
Calculation
The Money Flow Index (MFI) calculation involves the following steps-
1. Typical Price = (High + Low + Close)/3
2. Raw Money Flow = Typical Price x Volume
3. Money Flow Ratio = (14-period Positive Money Flow) / (14-period Negative Money Flow)
4. Money Flow Index = 100 – {100 / (1 + Money Flow Ratio)}
MFI interpretation
MFI is a volume-weighted version of RSI as it is interpreted similarly to the RSI oscillator; however, the difference in MFI is with regard to volume. Due to the volume feature, MFI works a little differently from RSI.
By computing the indexed value depending on the number of bars (as specified in the money flow index setting), a line is plotted on the chart that oscillates between 0 and 100 levels.
With the rise in stock price, the MFI also goes up, which signals increasing buying pressure.
On the other hand, MFI goes down with a price decrease, thus signaling decreasing buying pressure.
Therefore, you may predict the directional movement of the market simply by analyzing MFI.
Strategies using MFI:
Case 1: When price cuts above the 20 SMA from below and simultaneously MFI also cuts above the 40 line, it generates a buy signal.
Case 2: Similarly, when the price cuts below the 20 SMA from above and MFI also cuts below the 60 line, it generates a sell signal.

Like other technical indicators, MFI should also be used in conjunction with other technical analysis tools like chart patterns, volume and price breakouts to get confirmed signals produced by MFI.
Conclusion
So, now that we are at the end of this module. We have learned quite a few popular technical indicators used by market experts globally. But as the learning comes to an end, it is time to practice them well. In technical analysis, only practice can bring significant results in trading. So keep on practicing and keep learning about technical analysis from the several modules that we have prepared for ELM School.


